Enjoying The Hub?
Sign up for our free newsletter!

DeepDive: Who benefits from surging immigration? Hint: it’s not Canadian workers

DeepDive

Temporary foreign workers from Guatemala clear a field in Notre-Dame-de-l’Ile-Perrot, Que., June 4, 2023. Graham Hughes/The Canadian Press.

DeepDives is a bi-weekly essay series exploring key issues related to the economy. The goal of the series is to provide Hub readers with original analysis of the economic trends and ideas that are shaping this high-stakes moment for Canadian productivity, prosperity, and economic well-being. The series features the writing of leading academics, area experts, and policy practitioners. The DeepDives series is made possible thanks to the ongoing support of Centre for Civic Engagement.

Anyone who pays any attention to economic policy debates in Canada knows that our productivity performance in recent years has been disappointing—and that’s putting it politely. Carolyn Rogers, the senior deputy governor of the Bank of Canada, put it more bluntly in a speech in March when she said that Canada faces a productivity “emergency” and it is “time to break the glass.”

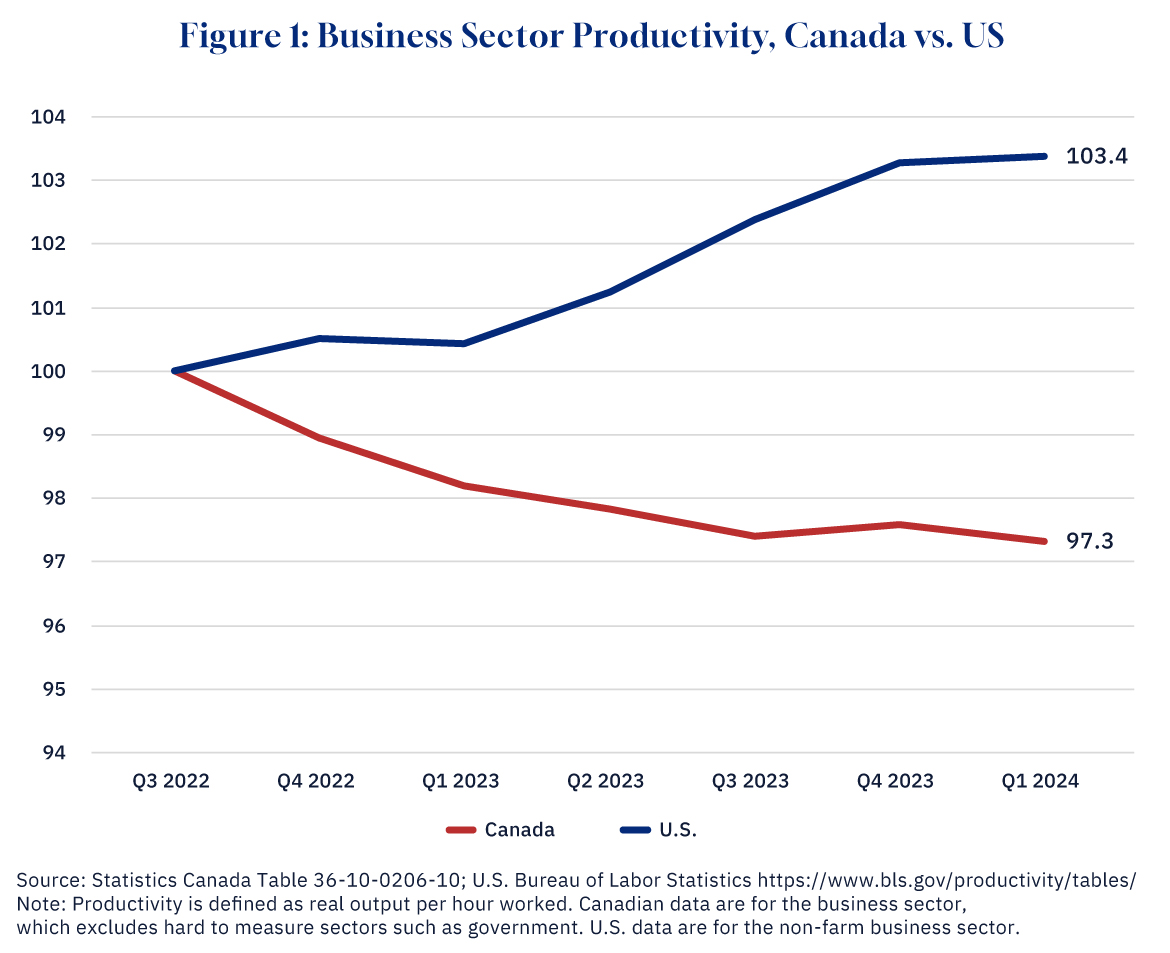
Not only is productivity—how much output each worker produces in an hour—not growing, but it is actually falling. As Figure 1 shows, Canadian productivity is lower now than it was in mid-2022 when the economy was coming out of COVID. Compare that to the United States, which has seen robust productivity growth since COVID and is now back to its pre-pandemic trend.
Graphic credit: Janice Nelson. 

Canada’s poor productivity record comes with real costs for ordinary Canadians in the form of lower wages and living standards than in the U.S. The growing Canada-U.S. labour productivity gap is now 30 percent and that manifests itself in $20,000 less in GDP per capita for Canadians relative to Americans.

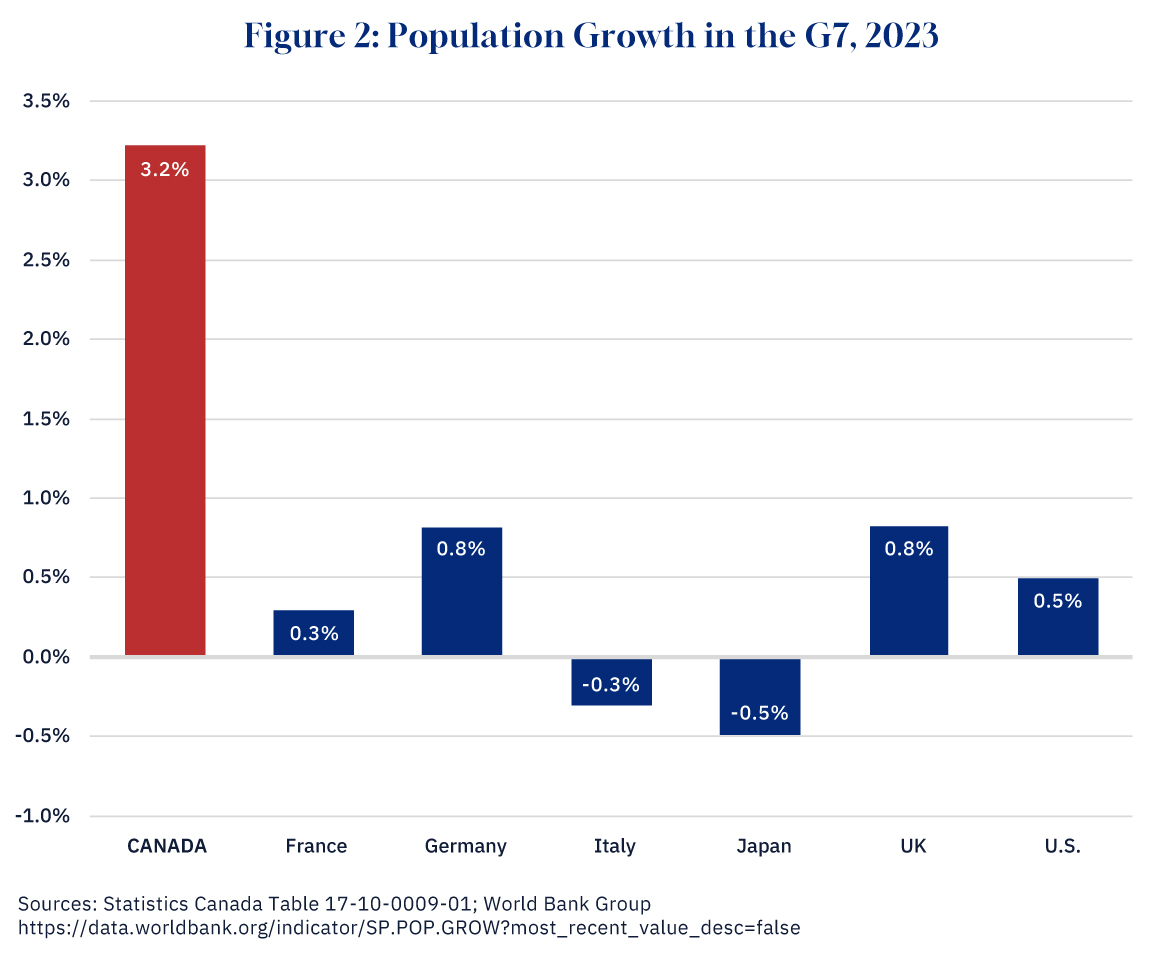
However, one area where Canada leads not just the U.S. but the developed world is population growth. As StatsCan reported in March, the Canadian population grew by 3.2 percent in 2023, blasting through the 40 million barrier to 40.8 million. This increase was the largest in percentage terms since 1957 when there was an influx of Hungarian refugees following the 1956 uprising. As Figure 2 shows, Canada’s population growth in 2023 was much higher than any other G7 country, much higher than the U.K. with 0.8 percent growth and the U.S. with 0.5 percent growth. Indeed, Canada’s population growth is more on a par with West African countries like Mali or Chad where women typically have five or six children.
Graphic credit: Janice Nelson. 

This surge in population did not come from women having more babies. As I have noted in an earlier Hub piece, Canada’s fertility rate reached a record low in 2023. Instead, 98 percent of Canada’s population growth came from immigration.

In this DeepDive we ask whether these two phenomena of falling productivity and rising immigration are connected. More specifically, has the surge in immigration had anything to do with Canada’s disappointing productivity performance?

What has driven the surge in immigration in Canada?

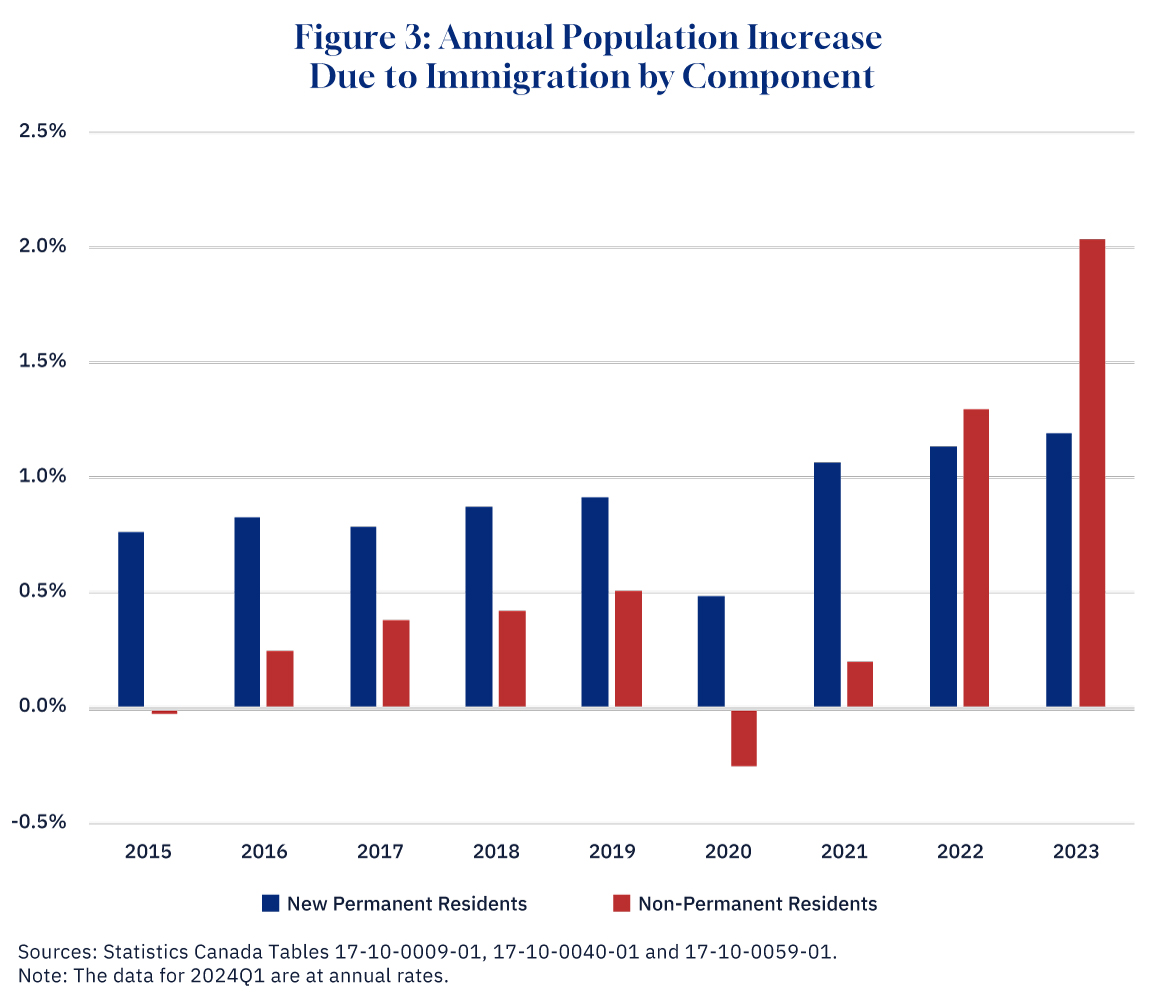
Let’s dive into the numbers. Figure 3 below shows the overall percentage increase in Canada’s population from immigration since 2015, the last year of the Harper government, divided up into two categories.
Graphic credit: Janice Nelson. 

The first is new permanent residents, who have been granted the right to live and work permanently in Canada. Often these immigrants will have been living abroad before obtaining permanent residence status, although in some cases they might have already been in Canada as temporary residents. About 40 percent of new permanent residents are selected on economic criteria; however, most are not: they are either family members of economic applicants (20 percent), family members of those who have already immigrated to Canada (20 percent), or refugees (15 percent).

As the chart shows, the number of new permanent residents has been growing. In 2015 they contributed 0.7 percentage points to Canada’s overall population growth of 0.8 percent; by 2023 they contributed 1.2 percentage points to overall population growth of 3.2 percent.

However, permanent residents have been surpassed as a contributor to population growth by the other category of immigrants: non-permanent residents (NPRs). There were very few in this category in 2015, but their numbers have grown rapidly: by 2023 they contributed 2.0 percentage points to population growth, so that almost two-thirds of Canada’s overall population growth was accounted for by NPRs.

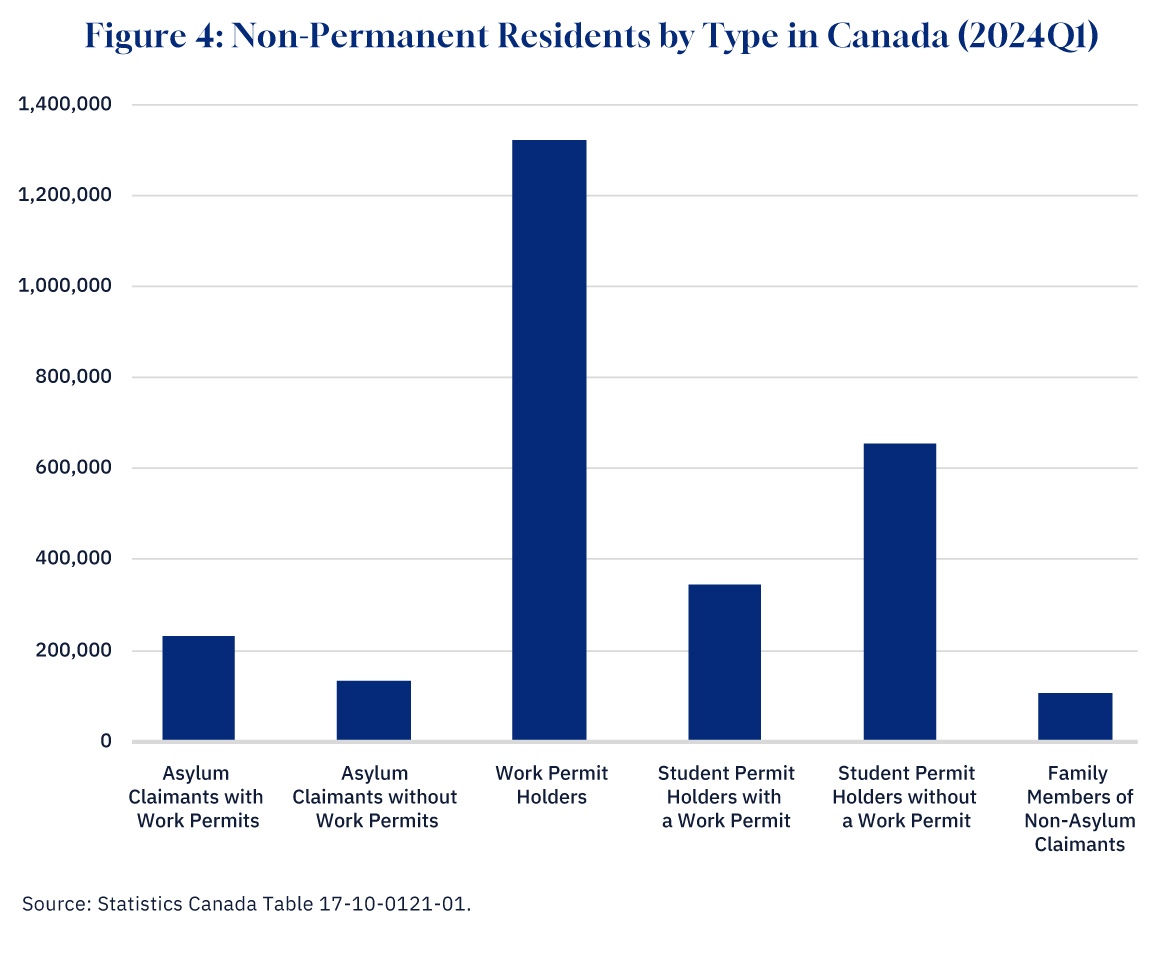
Who is included in the NPR category? Figure 4 breaks down the overall total of 2.8 million NPRs in Canada into its different components. Some are asylum claimants. This includes refugees from war-torn countries such as Ukraine, but also many people from countries like Nigeria, Mexico, and India who may be more motivated by economic circumstances. As Chart 4 shows, asylum claimants account for 360,000 of the NPRs in Canada. About two-thirds of asylum claimants have a work permit.
Graphic credit: Janice Nelson. 

A second category is temporary foreign workers—those with just a work permit. This includes not only low-skilled workers, such as people brought into the agricultural sector on a seasonal basis, but skilled workers in fields such as IT. This is by far the largest category of NPRs: 1.3 million people—about half the total.

A third category is students: Chart 4 shows that there are about a million foreign students in Canada. This is about half of the total, and of these about a third also have a work permit. Finally, there are about 100,000 family members of those NPRs who have work or study permits but who are not asylum claimants.

In total, therefore, 1.9 million (68 percent) of the 2.8 million NPRs in Canada are entitled to work. While not all NPRs with a work permit—particularly students—would actually be employed, the vast majority will be, as their residence in Canada is tied to having a job. Furthermore, it may well be that some NPRs who are not entitled to work are nonetheless doing so given that companies that hire migrants who are not entitled to work are rarely prosecuted.

Having documented the surge in Canada’s immigrant population, it is now time to look at its potential effect on productivity growth.

What drives productivity growth?

To understand the potential link between immigration and productivity, we need to have a framework for thinking about how productivity growth happens. Although there are certainly different ways to think about this question, the standard approach—reflected for example in Statistics Canada’s productivity statistics—is to ascribe growth to one of three sources: innovation; more capital goods; and/or a higher quality labour force.

The first source of productivity growth, innovation, includes new scientific discoveries (such as electricity), new ways to organize production (such as the assembly line), and new products (such as the automobile). The factors that lead to innovation and that influence the rate of adoption of new ideas, processes, and products throughout the economy are still a bit mysterious to economists, and the contribution of innovation to growth is generally measured as a residual, i.e. what can not be explained by other factors.

How might immigration affect innovation? It is certainly true that in the U.S., for example, the immigration of skilled scientists and engineers has contributed significantly to innovation. This does not seem to be as much the case for Canada or other countries, perhaps the U.S., as the world’s largest economy and strongest research universities is able to attract top talent in a way that other countries can not. It should also be borne in mind that countries like Japan and South Korea that have very little immigration have nonetheless managed to construct very innovative economies.

Immigration and the capital stock

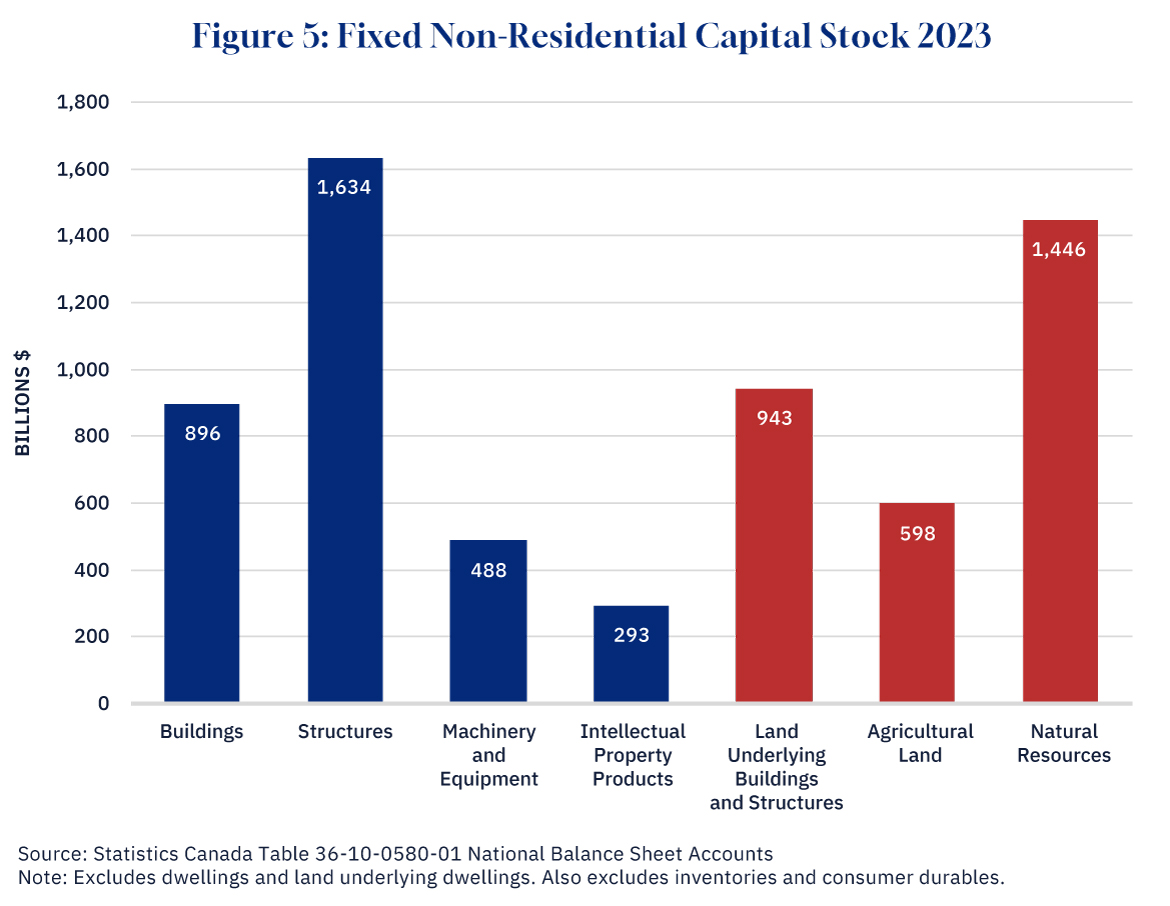
The second source of productivity growth is the capital stock, which is essentially all the things, both tangible and intangible, that are used by workers to produce goods and services. Figure 5 below shows the different components of Canada’s capital stock for 2023. On the left-hand side, in blue, are produced assets, or capital goods that have been manufactured in some way. Produced assets comprise buildings (such as factories, shopping malls, and office buildings), structures (such as highways, mines, and pipelines), machinery and equipment (such as computers and robots, but also trucks and machine tools), and intellectual property products (such as software and R&D). In total, these had a market value of $3.3 trillion dollars in 2023.
Graphic credit: Janice Nelson. 

On the right-hand side of the chart, in orange, are non-produced assets. These comprise the land upon which buildings and structures sit, agricultural land used for farming, and natural resources. The latter includes not just proven energy and mineral reserves, but also timber and even radio spectra. In total, these had a market value of $3.0 trillion in 2023.

Adding together both produced and non-produced assets gives a total of $6.3 trillion dollars, slightly more than double Canada’s GDP. This means that each Canadian worker has on average $312,000 worth of capital to help him or her produce goods and services. This average, which economists call the capital-labour ratio, is a key determinant of productivity. The more machines, factories, land, and natural resources a worker has, the more productive that worker will be.

High-income countries such as Canada or the U.S. typically have much higher capital-labour ratios than low-income countries such as India or Nigeria (the exceptions are countries like Saudi Arabia with huge oil reserves). China went from being a low-income country to an upper-middle income in large part by investing heavily in its capital stock.

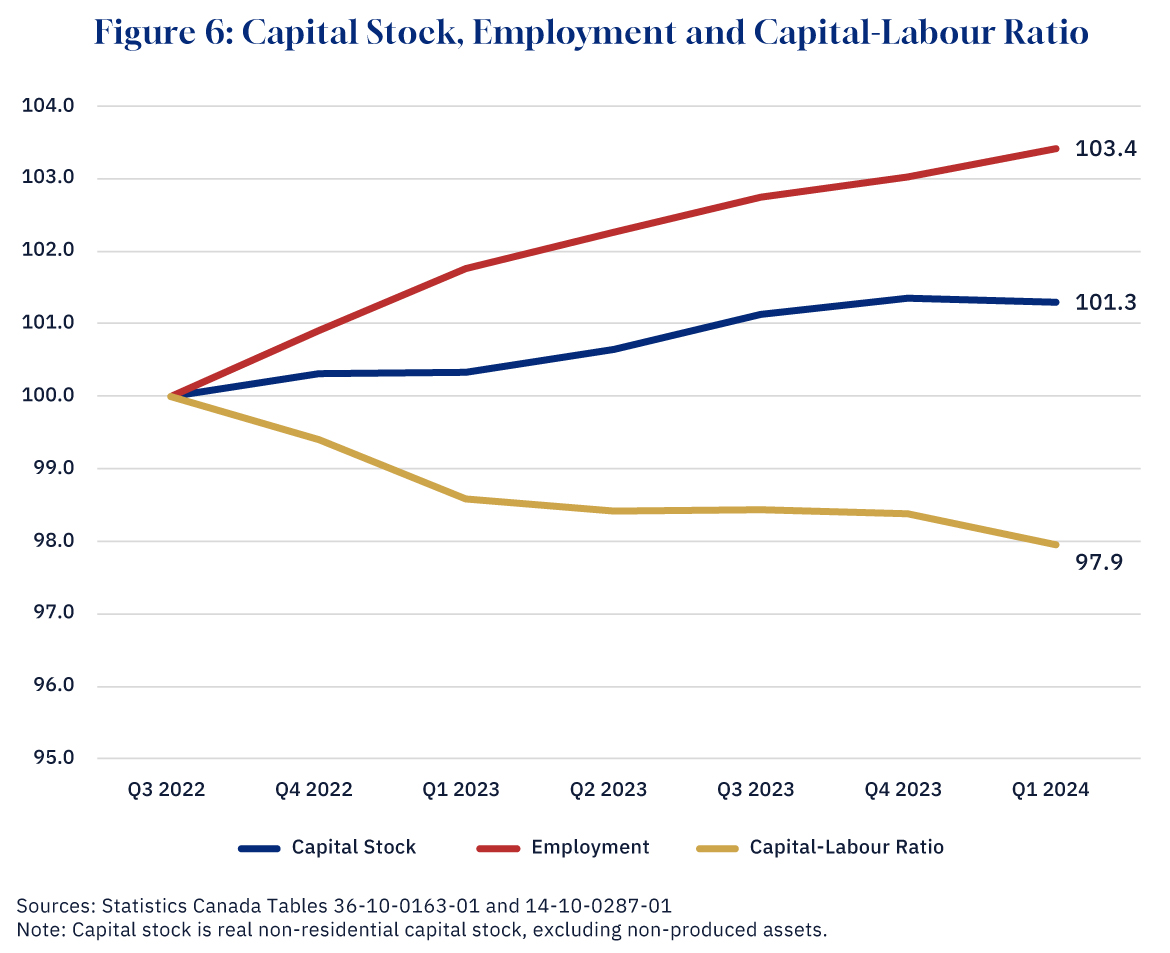
What happens when there is a sudden increase in the workforce? The initial impact will be a decline in the capital-labour ratio. On average, each worker will have less capital to work with and will therefore be less productive. Output will go up—there are more workers in the economy—but output per worker will go down, putting downward pressure on wages across the economy.

As Figure 6 shows, this is exactly what has happened. The produced capital stock has risen by more than 1 percent since the third quarter of 2002, but employment, driven by the surge in immigration, has risen by more than 3 percent, so that the capital-labour ratio has fallen by two percent, helping cause the slide in productivity that we saw in Figure 1.
Graphic credit: Janice Nelson. 

Not everyone is worse off though. For the owners of capital, an influx of workers is beneficial. Workers are cheaper, and with more workers per unit of capital, they get more output. This is why business is often a strong supporter of higher levels of immigration.

In the short run, then, more immigration means lower productivity. However, what happens over time? After all, countries with bigger populations aren’t necessarily less productive. Tthe U.S. has nearly ten times Canada’s population and has higher productivity than Canada.

The answer is that over time the capital stock, at least the produced part of it, adjusts. With a bigger economy, businesses have an incentive to invest more, and productivity will start to recover. Even the stock of non-produced assets can grow if there is more investment in mining exploration or if more land is cleared for agriculture or zoned for commercial or industrial use.

That’s the good news. The bad news is that this adjustment can take a very long time. The reason for this is that much of the capital stock is very slow to adjust. Developing more land for buildings or factories is a notoriously long process in Canada, and the time it takes to get permission for a major resource project is even longer. Even without these external constraints, it takes time to plan, get internal approvals, arrange financing, and actually complete construction. According to the head of the Mining Association of Canada, a new mine can take up to 15 years to become operational.

Thus, at least in the near term, we would expect an increase in immigration to reduce productivity, as the existing stock of capital, both produced and non-produced, now has to support a greater number of workers. Just as in the housing market, the supply of physical assets cannot adjust quickly to a surge in population.

Immigration and labour quality

The third driver of productivity growth is the quality of the labour force, or how much human capital—skills, education, experience—that a worker possesses.

If immigrant workers had the same characteristics as Canadian-born workers, we would expect immigration to have no impact on labour quality. However, immigrants do not have the same characteristics as Canadian-born workers. On the one hand, the countries that Canada draws the bulk of its immigrants from (India and China) have much lower levels of human capital than Canada. On the other hand, those who choose to emigrate are often better educated, and our immigration system is designed, in part, to select for the “best and the brightest”—immigrants with more human capital.

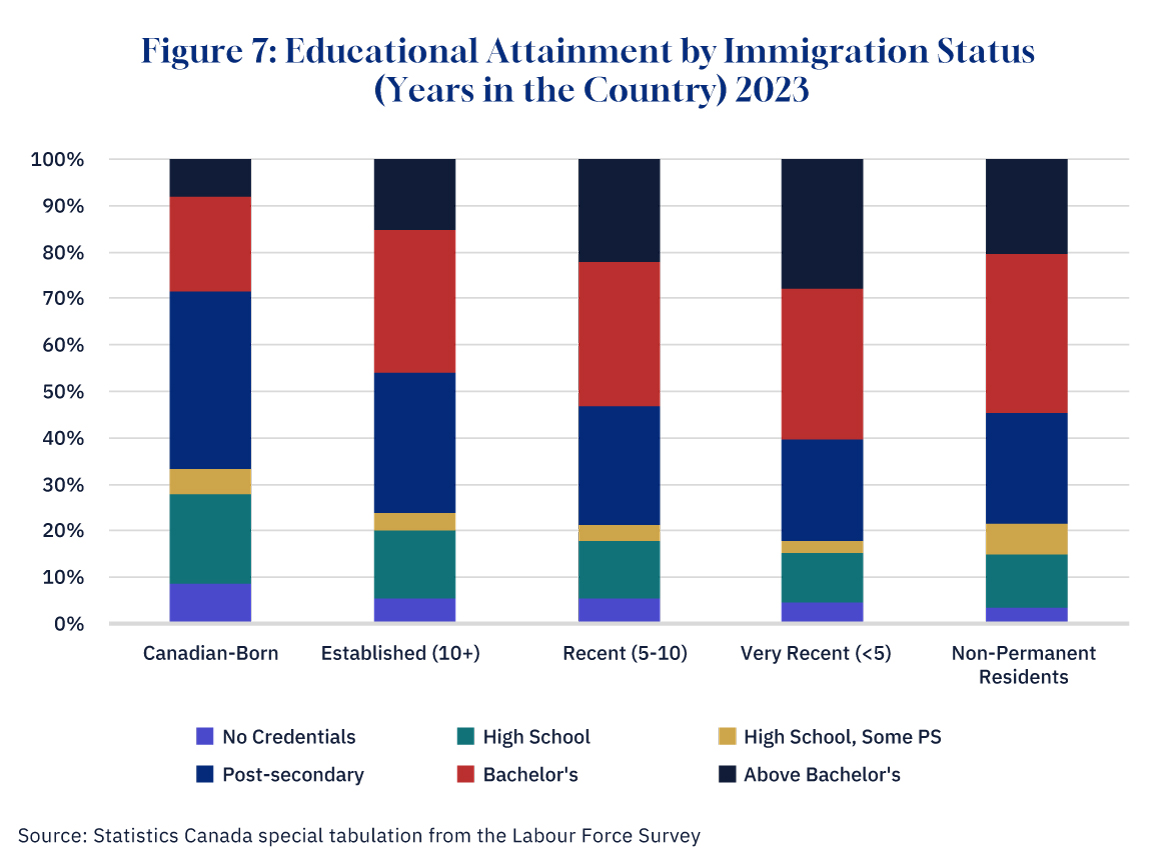
In practice, what we see is that immigrants do have fairly high levels of educational attainment. In Figure 7 below we can see that 60 percent of very recent immigrants, and 55 percent of non-permanent residents, have a bachelor’s degree or above. In comparison, less than 30 percent of the Canadian-born population has a bachelor’s degree or above. (Of course, it may well be that the Labour Force Survey does not capture many lower-skilled immigrants who may not be as willing or indeed able to participate in surveys.)
Graphic credit: Janice Nelson. 

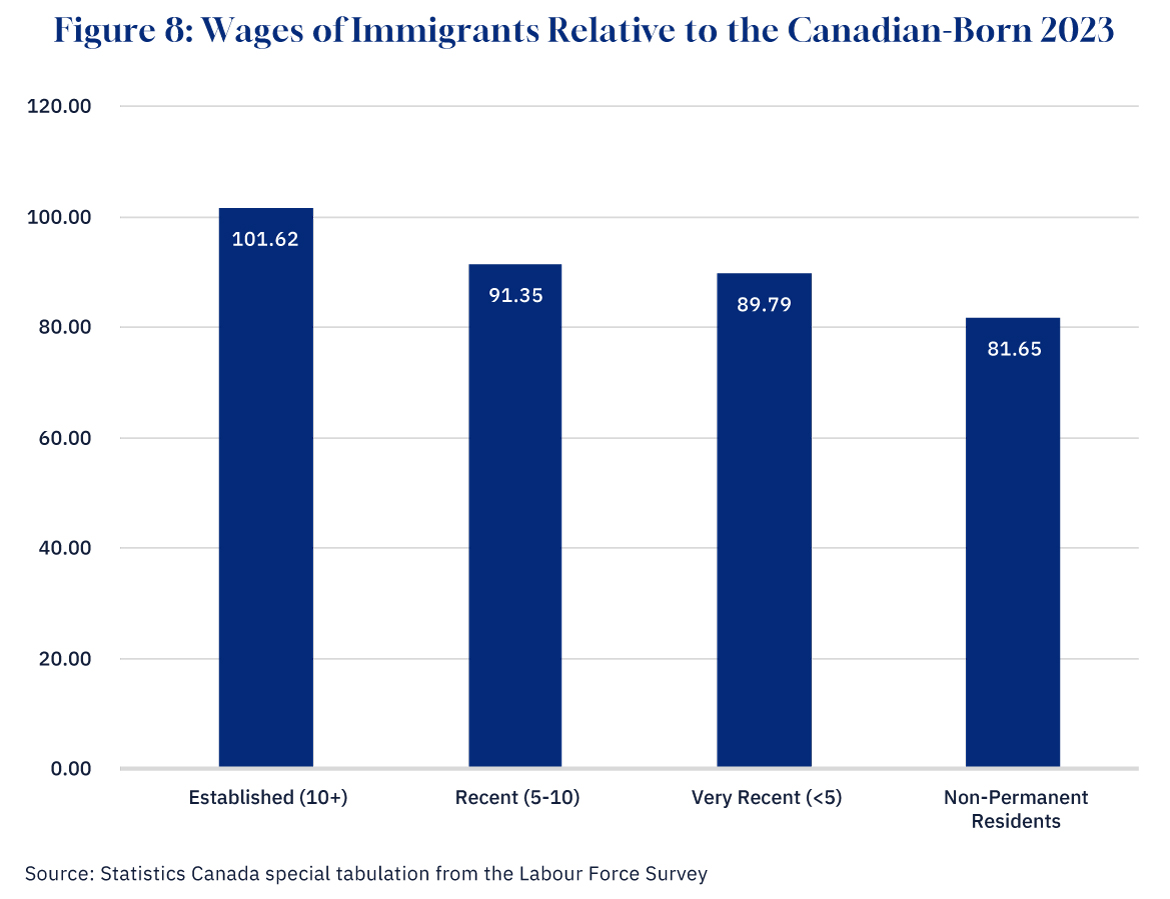
However, this superiority in educational credentials does not necessarily translate into higher earnings. In Figure 8 below, we show the wages of immigrants relative to Canadian-born workers. Established immigrants—those who have been permanent residents of Canada more than ten years—have earnings slightly above that of the Canadian-born. However, recent immigrants—permanent residents between five to 10 years—and very recent immigrants—permanent residents for less than five years, have earnings that are around 90 percent of Canadian-born workers. Non-permanent residents have even lower relative earnings—slightly above 80 percent of Canadian-born workers.
Graphic credit: Janice Nelson. 

This suggests that recent immigrants’ credentials are less valued, or that they have less relevant work experience or skills. Lack of familiarity with Canada’s official languages and culture may also play a role. Occupational licensing barriers are also likely to impede educated immigrants from entering many professions given that it is not always easy for professionals to be licenced if they come from another province of Canada, let alone another country.

Could outright discrimination against visible minorities play a role, with employers offering wages to recent immigrants that are lower than their level of productivity? The fact that established immigrants have caught up with their Canadian counterparts would seem to suggest not. Time in Canada, rather than ethnic origin, seems to be what is driving lower wages for immigrants. (Note that even among established immigrants, only 23 percent were born in Europe and the U.S.)

However, while the wage gap between immigrants and the Canadian-born does dissipate, it takes a significant amount of time: as Chart 7 shows, those immigrants who have been in Canada for five to 10 years still earn only 91 percent of the Canadian-born. This suggests that a surge in immigration such as the one that we have just experienced is likely to reduce labour quality for a long period of time until the new arrivals catch up.

Key takeaways: do the negative impacts on productivity mean that immigration is negative for the Canadian economy?

It does seem likely then that the surge in immigration over the last few years, particularly amongst NPRs, has contributed to the recent decline in Canada’s productivity. Because the capital stock moves slowly, faster population growth reduces the available stock of machinery, buildings, and natural resources per worker, making them less productive. And because new immigrants and NPRs are less productive than immigrants who have been in the country for a long period of time, a surge in immigration lowers the average quality of the workforce. The other key driver of growth, innovation, is unlikely to respond significantly to immigration, given that ideas tend to flow easily over national borders.

None of this means that no one in the economy benefits from immigration. Owners of capital certainly benefit when labour is cheaper and more abundant. However, the principal beneficiaries of immigration are immigrants themselves. Given the huge wage disparities between Canada and the developing countries from which the vast majority of immigrants come from, the potential economic gain to immigrants is very large. The costs of relocating and adapting to a new country are small in comparison.

Furthermore, there are things governments can do to improve the economy’s adjustment to the higher immigration. Policies to improve the investment climate would help increase the capital stock, and better credential recognition would reduce the wage gap for new immigrants.

However, policy action on these fronts can only go so far. Ultimately, it is always going to take some time for the capital stock to catch up with a bigger workforce, and new immigrants are likely to be less productive for a significant period (unless Canada is willing to become much more selective in its immigration policy, cutting back on family class immigrants, and making selection criteria much more stringent). This means that if immigration remains at its current level, it is likely to remain a drag on productivity and therefore our standard of living for some time to come. Whether that proves politically sustainable remains to be seen.

Tim Sargent

Tim Sargent is Director of the Domestic Policy Program at the Macdonald-Laurier Institute and a Distinguished Fellow at the Centre for International Governance Innovation. He is also the Deputy Executive Director of the Centre for the Study of Living Standards.

DeepDive: Canada has more doctors than ever before. Here’s why it doesn’t feel like it

DeepDive

Doctors perform a procedure at Sacre-Coeur Hospital, July 26, 2023 in Montreal. Ryan Remiorz/The Canadian Press.

DeepDives is a bi-weekly essay series exploring key issues related to the economy. The goal of the series is to provide Hub readers with original analysis of the economic trends and ideas that are shaping this high-stakes moment for Canadian productivity, prosperity, and economic well-being. The series features the writing of leading academics, area experts, and policy practitioners. The DeepDives series is made possible thanks to the ongoing support of Centre for Civic Engagement.

Last month’s Council of the Federation meeting dedicated a lot of attention to the “recruitment and retention of health-care workers” as a key part of addressing broader health-care challenges. The notion of a major labour supply problem in Canadian health-care systems is commonly represented in the news media and popular conversation. Scarcely a week goes by without yet another story or study about physician access and shortages in Canada’s health system.

There’s no doubt that family physicians play a crucial role as the point of first contact and gatekeeper for health services, and it has been estimated that there are at least 6 million Canadians without access to a family or primary care physician, with some estimates being higher.

While Canada is not alone in having physician access issues, it remains that, among the ten high-income Commonwealth Fund Survey countries, adults in Canada recently reported the lowest rate of having a regular doctor at 86 percent, with New Zealand and the Netherlands at the top at 97 and 99 percent respectively.

Why Canadians continue to experience a health-care system with shortages of physicians and other health-care professionals is a health policy problem springing from a conjunction of forces that span provincial and federal policies towards health care and its funding, physician behaviour, and demographic and technological changes.

Yet there’s also a risk here that we can overstate or at least misunderstand the problem. The truth is that in the case of physicians Canada currently has the most physicians it has ever had. The issue does not appear to be a shortage in the number of physicians per se, but rather the quantity and mix of output physicians produce relative to the incentives available.

This DeepDive aims to assess whether Canada actually has a physician supply problem and provide an overview of the burdens that Canadian physicians face.

Does Canada have a physician shortage problem?

The basic dimensions of the problem are well-established. Nationally, a Canadian Medical Association Journal (CMAJ) report has stated that as many as one-fifth of Canadians are without a primary care physician, but there is variation across Canada’s regions, with 13 percent of Ontarians saying they are without a family physician while 27 percent of people in British Columbia and 31 percent in Atlantic Canada say they don’t have one.

These numbers have increased rather dramatically since the pandemic, given that in 2019, Statistics Canada estimated there were 4.5 million without a family physician. However, this is a long-standing problem going as far back as 2005 when 14 percent of Canadians—at the time 3.5 million people—reported having no family physician. Moreover, even with a family doctor, large proportions of Canadians are reporting difficulty in getting appointments, as 29 percent of those with a physician said it was hard to get an appointment.

In trying to understand the issues affecting physician supply and access, the first step is to look at physician numbers. When it comes to international comparisons, Canada ranks near the bottom among the OECD countries for physicians per 1,000 population. In 2021 (See Figure 1), the number of doctors in OECD member countries ranged from 2.5 or fewer per 1,000 population in Türkiye, Colombia, and Mexico to over 5 per 1,000 in Norway, Austria, Portugal, and Greece.

Of 47 countries compared by the OECD in 2021, Canada ranked 35th at 2.9 physicians per 1,000 population. Canada is actually above the United States and Japan at 2.7 and 2.6 per 1,000, respectively, but well below countries such as Italy at 4.1 or Denmark at 4.4. There are, however, some caveats to these numbers. For example, the numbers in Portugal and Greece are overestimates as they include all doctors licensed to practice, not just those actively practicing. As well, while many European countries have higher physician per capita numbers, this is also a function of health systems built around more physician-centred services with lower ratios for other health professionals such as nurses.

Graphic credit: Janice Nelson. 

Another point to make is that while Canada ranks low in physicians per capita, it has seen substantial growth in numbers over the last decade. When it comes to the percentage increase in physicians per 1,000, Canada is mid-ranked across these 47 OECD comparison countries in the increase since 2011. Yet, if one looks at physician numbers in Canada over the longer term, Canada has the most physicians per capita that it has ever had. Figure 2 plots the total number of physicians per 100,000 population in Canada from 1971 to 2022, revealing three distinct phases. First, there was a period of increase from 1971 to 1993 that saw physicians per 100,000 rising from 125 to 192—a 54 percent increase. From 1993 to 2007, numbers remained flat, averaging 189. From 2007 to 2022, they again increased from 194 to 247—an increase of 27 percent.

Graphic credit: Janice Nelson. 

It should also be noted that these are national figures, and there are variations in physician supply not only by province and territory but across rural and urban areas. For example, in 2022, total physicians per 100,000 population ranged from highs of 270 per 100,000 in British Columbia and Nova Scotia to lows of 215 per 100,000 in Prince Edward Island and Saskatchewan, respectively. Then there are the three territories that range from a high of 203 in The Yukon to a low of 72 in Nunavut.

Figure 3 shows that while these trends have marked both family and specialist physicians, it’s family physicians that appear to have taken the greater blow in the 1993 to 2007 period. This decline came after a period when they increased faster than specialist physicians. From 1971 to 1993, family physicians per 100,000 population increased by 64 percent—from 62 to 102 per 100,000—while specialist physicians grew only 45 percent—from 62 to 90 per 100,000. From 1993 to 2007, specialist physicians per 100,000 increased slightly while family physicians declined. Since 2007, specialist physicians per 100,000 grew by 30 percent, whereas family physicians increased by 25 percent, with the numbers now being nearly on par at 124 and 123 per 100,000, respectively.

Graphic credit: Janice Nelson. 

The post-1993 decline, particularly amongst family physicians, has often been attributed to the implementation of the Barer-Stoddart Report. In the wake of slowing economic growth and rising health expenditures, provincial health ministers commissioned health economists Morris Barer and Greg Stoddart in 1990 to produce a report on medical resource policy. They delivered back in 1991 with a massive report on medical training and practices that recommended, among other things, reducing medical school entry class size by 10 percent. The report also recommended reforming physician payment methods away from fee-for-service where possible, increasing the use of alternative service delivery models, and initiatives to boost physician access in rural communities. Physicians in that era came to be seen as a factor in rising health expenditures based on theories of supplier-induced demand that argued as gatekeepers to the health-care system, physicians could essentially create their own demand for services.

The result of a reduction in medical school admissions was eventually physician shortages and care disruptions in the 1990s and beyond. The responsibility for implementing the report rested with provincial governments, which focused mainly on reducing physician supply without the additional human resource measures the report suggested. All this occurred against the backdrop of federal health transfer reforms that brought about the Canada Health Transfer in the wake of the federal fiscal crisis of the 1990s.

Indeed, one can construct a counterfactual physician supply for Canada by running a regression of total physicians per 100,000 population from the period 1971 to 1993 and then using the coefficients to project physician numbers to the present, as shown in Figure 4. The divergence in physician supply occurred after 1993, and even with increases in medical school enrollment that began after 2005, the long-term effects on supply are apparent as by 2022, physicians per 100,000 stood at 247, while if they had continued to increase at the pre-1993 trend—all other things given—the number would be 16 percent higher at 287. Put another way, there could presently be approximately 16,000 more physicians on top of the current 96,000 physicians in Canada if growth had continued at pre-1993 rates.

Graphic credit: Janice Nelson. 

In the end, physicians are viewed not only as health service providers by provincial governments but also as cost centres and a source of expenditure increases and, ultimately, budgetary pressures. While governments seek to meet the need for health-care services through physicians, the supply of physicians is also regulated by governments through medical school admissions and licensing, and payment systems have sought to ensure efficiencies in expenditures.

Governments perceive physicians as a major cost driver despite evidence that while “physician numbers are a positive and significant driver of provincial government health care spending,” it remains that “the overall contribution to real per capita health spending is relatively small for most provinces.” Nevertheless, provincial-territorial government spending per physician, after adjusting for inflation, has actually been in decline for over a decade.

Figure 5 presents a plot of real provincial-territorial government spending per physician (in 2020$), which peaked in 2010 and has since declined by over 8 percent—from $459,000 to $420,000. This decline reflects the move by many provincial governments since the Great Recession period to hold down fee increases and cap payments to physicians, which may, in turn, affect their labour supply behaviour. In lieu of fee increases, provincial governments have encouraged their physicians to incorporate, given the more favourable corporate tax rate regime, but recent changes to federal capital gains taxation inclusion rates have complicated that strategy. However, part of this spending decline is also a function of physicians seeing fewer patients as a result of two other reasons: first, physicians have been working fewer hours over time and of the remaining time, a substantial portion is filled with paperwork.

Graphic credit: Janice Nelson. 

Growing pressures on physician services

Access and availability of physician services are affected by demand and supply factors. These are rooted in the structure of our health-care system and changing social, economic, and demographic forces. The demand factors include increasing utilization of services per capita. There is also a growing population as Canada’s population has soared past 40 million from 35 million a decade ago. Then there are the increased demands from an aging population as the proportion over age 65 grows in conjunction with rising needs in mental health, particularly amongst younger populations. Technological change also offers new and better procedures—witness, for example, the improvements in cataract care and knee and hip replacements—that, in turn, can foster enhanced demand and increased expectations.

While physician supply has increased, many current physicians are reaching retirement age and leaving the workforce, counteracting the effects of increased domestic medical school graduates. It has been estimated that one in six family doctors are nearing retirement age. While some of this could be counteracted by recruiting more international medical school graduates, there is again a long process for accreditation of these graduates and a shortage of residency positions for them, thereby restricting their entry into the physician workforce. Also, even when more family physicians are trained and graduated, a larger proportion don’t go into traditional primary care but rather go into other fields, such as sports medicine, work solely in hospital emergency rooms or anesthesiology, or work part-time. Part of this is a function of changing preferences, and part is due to monetary incentives given the costs and administrative burdens of running family practices. Obviously, financial and market incentives are a factor if physicians pursue work where they can earn more than they could by seeing more patients as a family physician where fees are capped.

As well, on average, physicians are working less than they did a decade ago as more seek better work-life balances. Indeed, in a recent study by Boris Kralj, Rabiul Islam, and Arthur Sweetman of McMaster University, the authors used Statistics Canada labour force data to analyze the average weekly hours worked by physicians over the 1987–2021 period. Overall, weekly physician work hours remained stable from 1987 until 1997, after which they declined—average weekly hours decreased by 6.9 hours from 52.8 in 1987–1991 to 45.9 in 2017–2021. Among male physicians, work hours declined notably after 1997, while those of female physicians remained relatively stable at around 45 per week. Hours worked by married physicians also declined significantly, amounting to 7.4 fewer hours per week, while unmarried physicians displayed a decline of 2.2 hours. When population aging and population growth are accounted for in conjunction with declining work hours, it becomes apparent that boosting effective physician supply is more than simply increasing physicians per 100,000 population.

While physicians are working fewer hours, they are also experiencing higher administrative burdens given the highly regulated nature of provincial government health systems that reduce patient-centred working time and the explosion of technology that has expanded health information. Governments and health bureaucracies ultimately determine what public health services should be, what procedures are necessary or unnecessary, and what the budgetary envelope will be. The allocation of public money requires accountability, and this desire for efficiency, combined with new technology, has created an exponential increase in paperwork and administrative costs for physicians.

According to the Canadian Medical Association (CMA), the time spent on unnecessary administrative work by physicians, which takes up 18.5 million hours per year and is equivalent to 55.6 million patient visits per year, could be streamlined by governments. For example, it takes most physicians 21-30 minutes to fill out a typical federal disability form. Indeed, suggestions for reducing the administrative burden on physicians include simplifying, reducing, or eliminating federal forms, eliminating unnecessary sick notes, and improving health information systems to make data clear and accessible.

This administrative burden generates burnout, especially amongst family practitioners, more than half of whom say they spend excessive amounts of time on electronic medical records and forms at home. Indeed, the financial burden for family practitioners of hiring staff to help deal with their office management and paperwork burden is another disincentive to new physicians entering family practice. Generally speaking, a family practice is a small business with rising costs and expenses, but physicians have no control over the price of their services while simply increasing the quantity of patients they see runs up against reducing time per patient, rising paperwork burdens, and work-life balance concerns. Adding to all the burnout is, of course, the aftermath of COVID-19, which saw the delay in diagnoses and surgeries and has generated a large workload of catching up.

Key takeaways

The physician supply issue, in the end, is a conundrum. Is there a shortage of physicians? Borrowing words from that quintessential bureaucrat, Sir Humphrey Appleby, the answer is both yes and no, if you forgive the expression. In 1971, there were 125 physicians per 100,000 population, and their services seemed abundant. In 2022, there are 247 physicians per 100,000, and there are issues of scarcity and access.

While there are more of both family and specialist physicians, a host of reasons have reduced their effective supply of services even as their numbers have expanded and total spending on health, both per capita and as a share of GDP, has grown. To this can be added a desire for better work-life balance by physicians in the wake of the pandemic’s more stressful work environment. Even when there are more physicians, an increasing proportion prefer to specialize, and even if they remain family physicians, they often do other gigs ranging from sports medicine to Botox either because of lifestyle considerations or financial incentives.

One can increase the number of physicians by boosting medical school enrollments further and licensing more international medical graduates, but this is no guarantee that they will go into family practice. Moreover, this takes time and ultimately runs up against provincial government budgetary constraints, given every new physician is seen as a billing number and cost centre.

Of course, one might venture that if governments don’t want to spend more on physicians or reduce their administrative burdens, the public should be allowed to spend their own money on attaining the physician services they need. Here, we come up against the politics of Canadian health care whereby there is a commitment to public health care and the belief that more private care creates an inequitable and unfair two-tier health care even as increasing numbers of Canadians experience the unfairness of not having access to the physician services they expect.

Provincial governments essentially ration access to public medical care but don’t make it easy to spend your own money on health care unless you choose to cross the border into the United States—a result that is a version of two-tier care we seem prepared to live with.

What is to be done? We have been doing pretty much the same thing for the last thirty years. Problems brew for a long time and then periodically rear their head as health crises of waiting lists, crowded emergency departments, and shortages of physicians and other health professionals fester.

These events are then punctuated by infusions of public money that provide a short-term solution and a return to the status quo, with U.S. health care providing an occasional safety valve for those with the financial means and ability to travel. Such a system worked adequately in the face of measured and slow changes in health-care needs and demand, and a relatively younger population, but the pandemic exacerbated the issues.

In the case of physician numbers, when combined with a pickup in the pace of demographic and technological change, increased utilization, and changes in physician work practices, the problems have become magnified. The pace of change has picked up, but our ability to cope with change has not. It’s time for some new thinking from governments.

Livio Di Matteo is a contributor to The Hub, Professor of Economics at Lakehead University, and a Member of the Canadian Institute for Health Information National Health Expenditure Advisory Group.

00:00:00
00:00:00