
When Canada’s previous two prime ministers, Stephen Harper and Justin Trudeau, were first elected in 2006 and 2015, respectively, they inherited relatively good economic and fiscal conditions. Ottawa’s balance sheet was strong. The economy was growing. And the global economy—including Canada’s trading relationship with the United States—was stable.
Mark Carney inherits a much different economic and fiscal outlook. Federal public finances have deteriorated after a decade of deficit spending and debt accumulation. The economy is marked by stagnation and declining living standards. And of course, the global economy in general and Canada’s relationship with the U.S. in particular are wracked by instability.
These challenges cannot be overstated. They’re likely to define Carney’s prime ministership. The four charts below illustrate them.

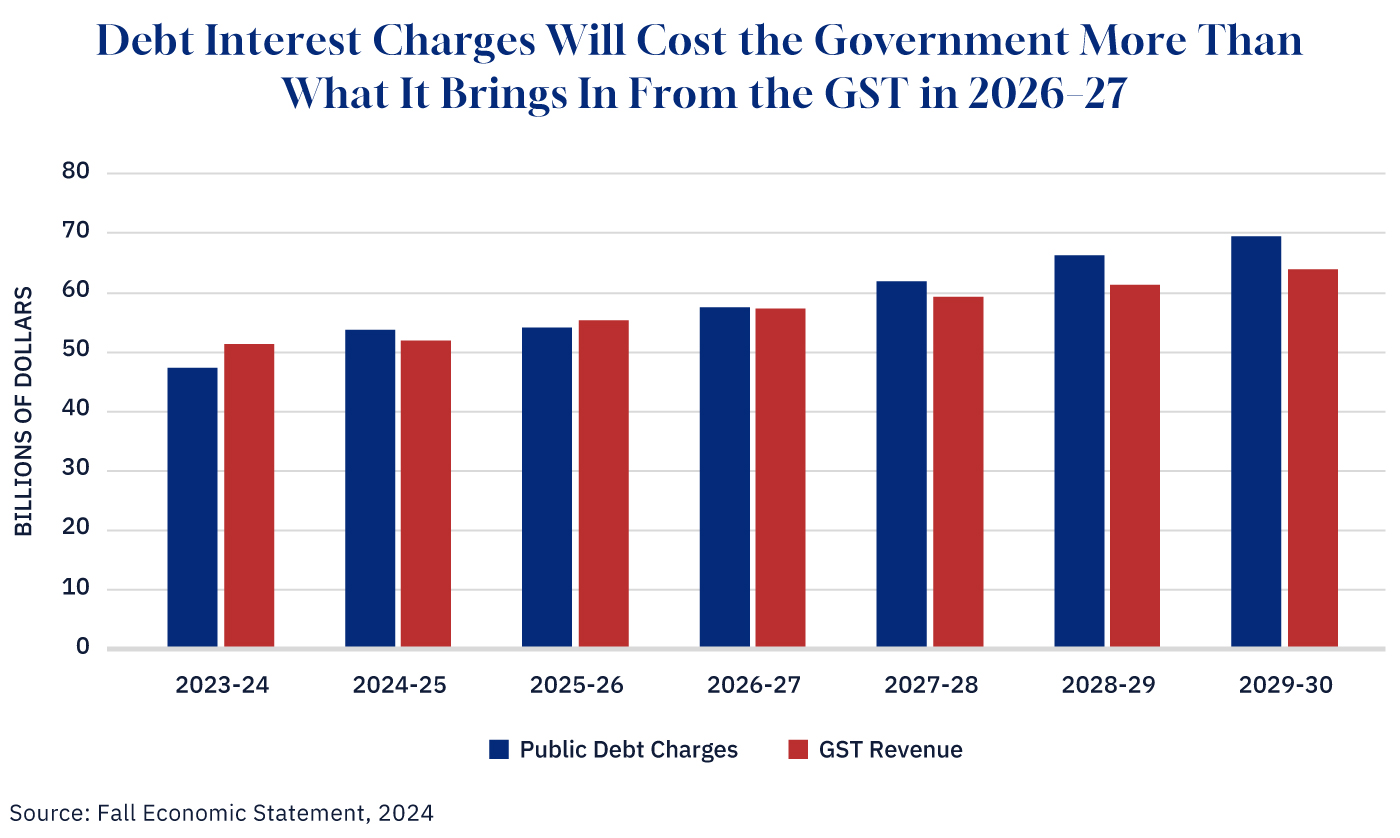
Ottawa’s rising debt costs
In Trudeau’s first full fiscal year as prime minister, the federal government’s debt-servicing costs amounted to 7.5 percent of total revenues. Today, they exceed 10 percent and are projected to reach 12 percent by the end of the decade.
For perspective, it can be instructive to look at debt-servicing costs as a share of GST revenues. In 2015-16, debt-servicing costs were $21.8 billion and GST revenues were $32.9 billion—debt payments thus represented 66 percent of GST revenues.
According to the pre-election Fall Economic Statement, in the current fiscal year, debt-servicing costs are projected to be $53.7 billion and GST revenues are $51.9 billion—debt payments are now more than 100 percent of GST revenues. Based on these projections, they’ll reach more than 108 percent of GST revenues by the end of the decade (see chart 1).
Graphic credit: Janice Nelson.
There’s reason to assume that these projections are conservative. In light of a deteriorating economy and the Liberal Party’s plans to increase debt-financed “investment,” it’s quite likely that a growing share of federal revenues will be dedicated to servicing Ottawa’s rising debt load.
The key point here is that in a world of higher debt and higher borrowing costs, there won’t be any free lunches. The Carney government will start to face real fiscal costs in the form of growing debt payments
Canada’s declining living standards
In 2014, the New York Times wrote positively about how Canada’s middle class was the richest in the world. Today, the conversation has shifted to Canadians’ declining living standards.
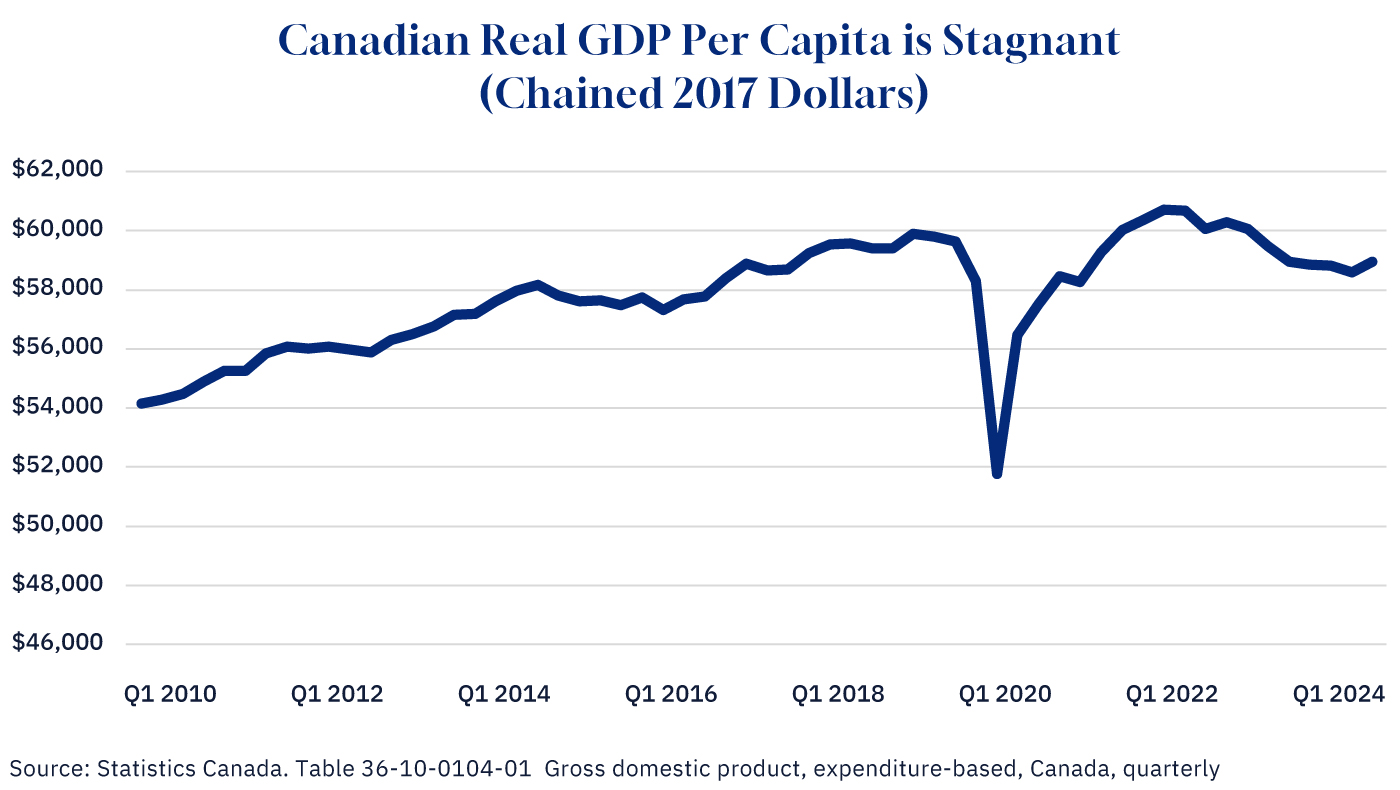
GDP per capita is a measure of jurisdiction’s economic output per person. It’s often used as a way to gauge a country’s living standards and economic well-being.
In the past 11 quarters between Q2 2022 and Q4 2024, Canada’s GDP per capita has fallen eight quarters (see chart 2). In Q4 2024, Canada’s real GDP per capita was $58,951—which is roughly what it was in 2017.
Graphic credit: Janice Nelson.
Canadians are falling behind their American neighbours
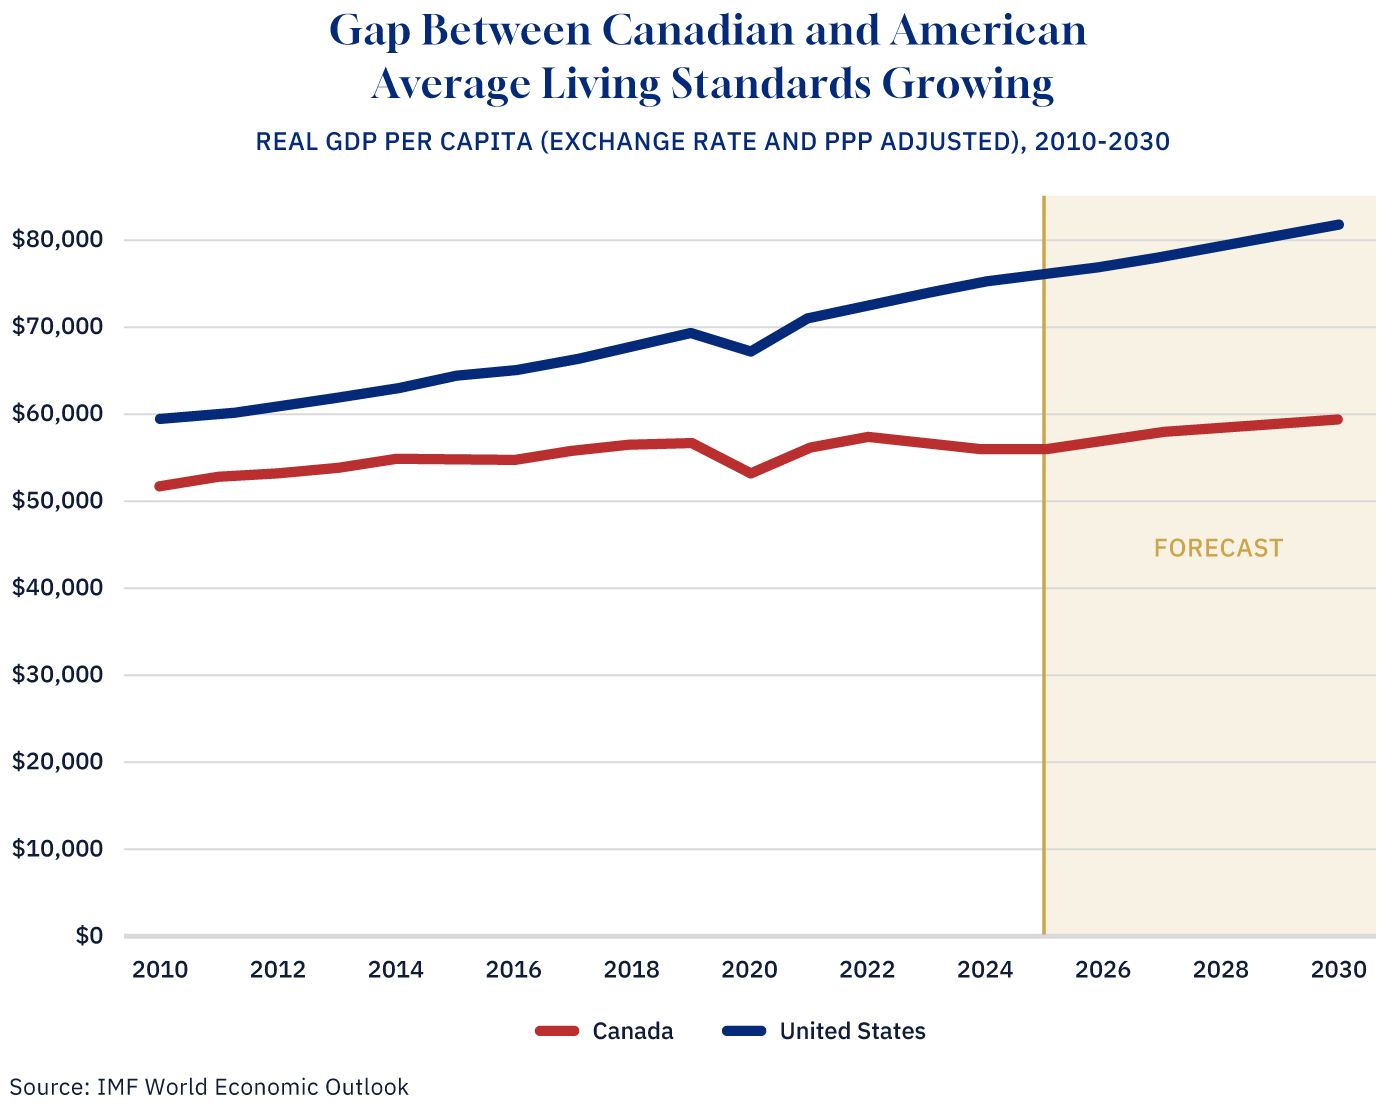
Another way to understand this trend is to compare Canada’s GDP per capita with that of the United States. The results are what economist Trevor Tombe has called “the great divergence.”
In 2015, Canada’s real GDP per capita was $54,923, or 85.1 percent of U.S. GDP per capita. Today, Canada’s real GDP per capita has fallen to 73.7 percent of the U.S. figure. By the end of the decade, it’s projected to fall further to 72.7 percent (see chart 3). That represents a gap of nearly $23,000 per person.
Graphic credit: Janice Nelson.
Canada’s trade dependency on the United States
Prime Minister Carney has talked about diversifying exports away from the U.S. market in light of President Trump’s tariffs. That’s not going to be easy. The share of Canadian exports to the U.S. is essentially unchanged since 2015, notwithstanding Canada’s growing network of free trade agreements with other countries around the world.
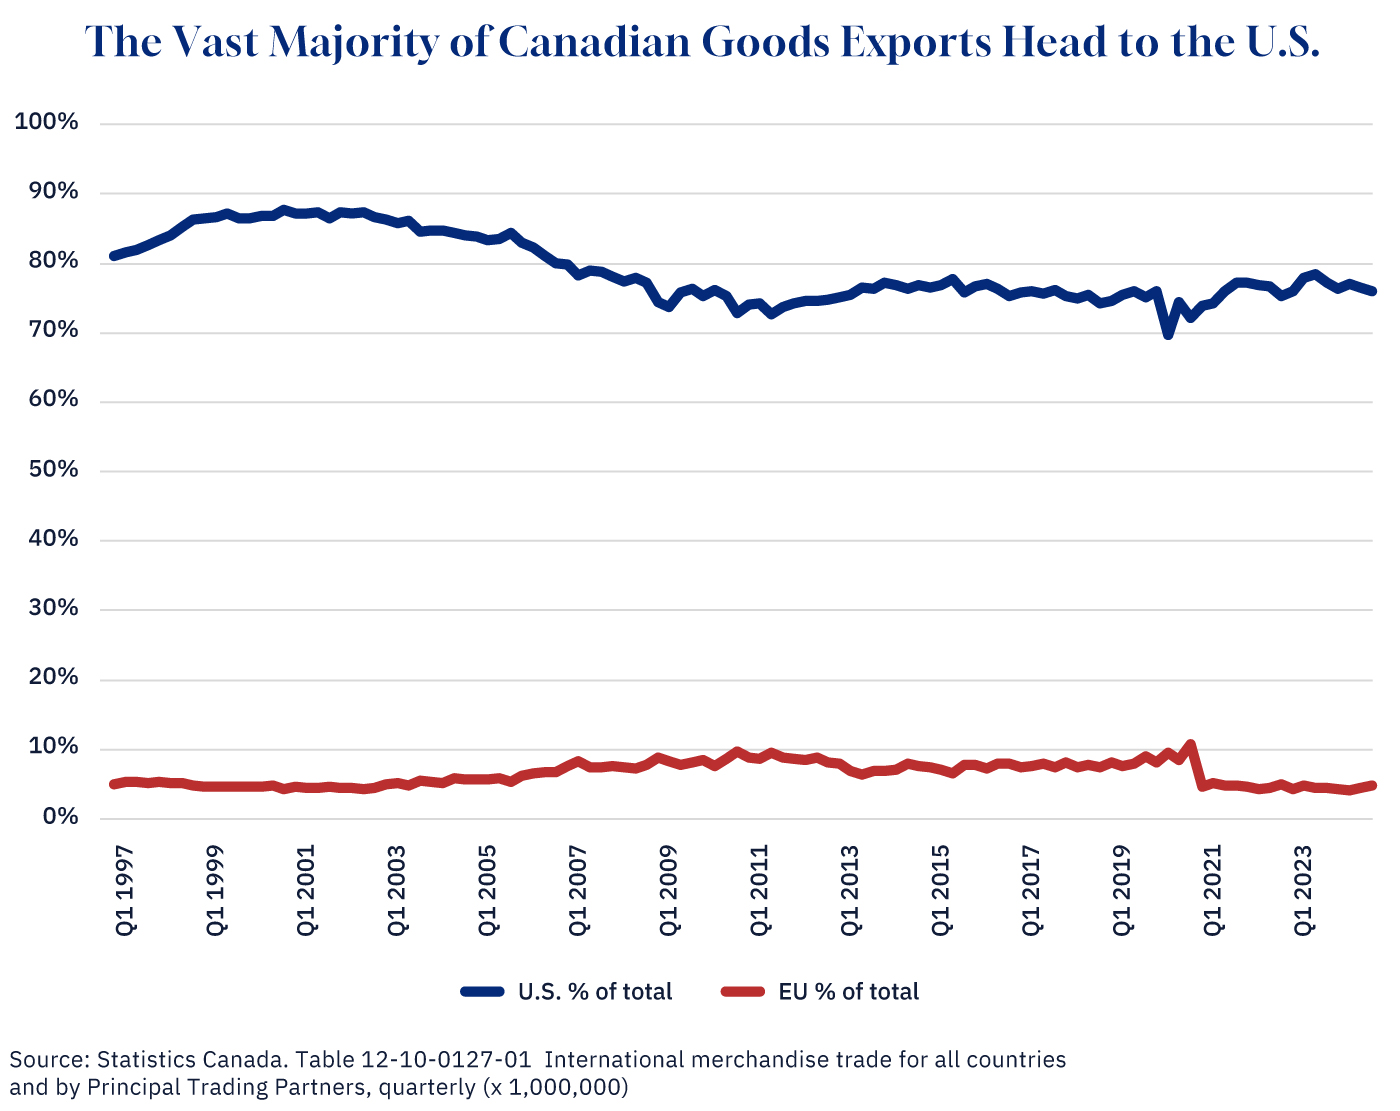
Statistics Canada’s data on quarterly merchandise trade with the U.S. is available back to 1997. Over this period, the share of Canadian exports to the U.S. (in terms of monetary value) has been as high as 87 percent in 2004 and as low as 72 percent in 2011.
It has since reached a rather steady share around 75 percent or so. In 2015, for instance, it was 76.5 percent. In Q4 2024, it was 75.9 percent (see chart 4). Exports to Europe, by contrast, have actually been falling. In 2015, they were 7.4 percent. In Q2 2024, they had declined to just 4.8 percent.
Graphic credit: Janice Nelson.
The takeaway here is that even as successive Canadian governments have opened up new export markets, including the European Union, the share of exports destined for the U.S. has either grown or remained unchanged.
This is important context for the Carney government’s negotiations with the Trump administration on a new “trade and security agreement.” Given the ongoing significance of the U.S. market for Canadian exports, the threat of tariffs is a huge asymmetric risk to Canada’s economy.