

Inflation is a major issue for many Canadians.
Google searches on the subject are at double their normal rate. Politicians are making hay. And an increasing number of Canadians express concern about their finances.
This attention is warranted. Consumer prices in December were 4.8 percent higher on average than a year earlier—the highest rate in over three decades. And it’s not just Canada. The United States recorded a 7 percent increase over that same period. Across developed economies, the average was (in November) nearly 6 percent.
From supply chain disruptions to monetary policy to federal spending, there’s no shortage of explanations out there for Canada’s high inflation. Many politicians and commentators are quick to place blame, often at the feet of a political opponent. But the reality is much simpler than most realize, with little blame to throw around.
It turns out, Canada’s high inflation comes down to just two items: one real, and one imaginary; one most of us buy regularly, and one that no one does. If it weren’t for these two specific items, inflation would be well within the normal range. I’ll explain.
What is inflation anyway?
Most understand that “inflation” refers to the average change in prices throughout the economy. And that is the right way to think about it.
In Canada, we track prices for approximately 1,200 items across 7,000 stores and average those up to an overall measure of consumer price changes based on what the typical consumer usually buys. If you spend 10 percent of your budget on gasoline, for example, then a 5 percent increase in gas prices will squeeze your overall budget by 0.5 percent. Repeating this across all items is, in a nutshell, how we measure inflation.
Simple enough. But, like with most averages, this masks large differences across items. Some things get cheaper; other things, costlier. Clothing, for example, is on average 4 percent cheaper today than before the pandemic while food is 6 percent higher.
This product-level information matters. Knowing what their prices are and their importance for the average consumer, we can decompose what’s driving the overall 4.8 percent inflation rate. I do this below and the results are both surprising and important: recent increases are driven mainly by gasoline and the depreciation of our homes (or, in StatCan’s wording, “homeowners’ replacement costs”).
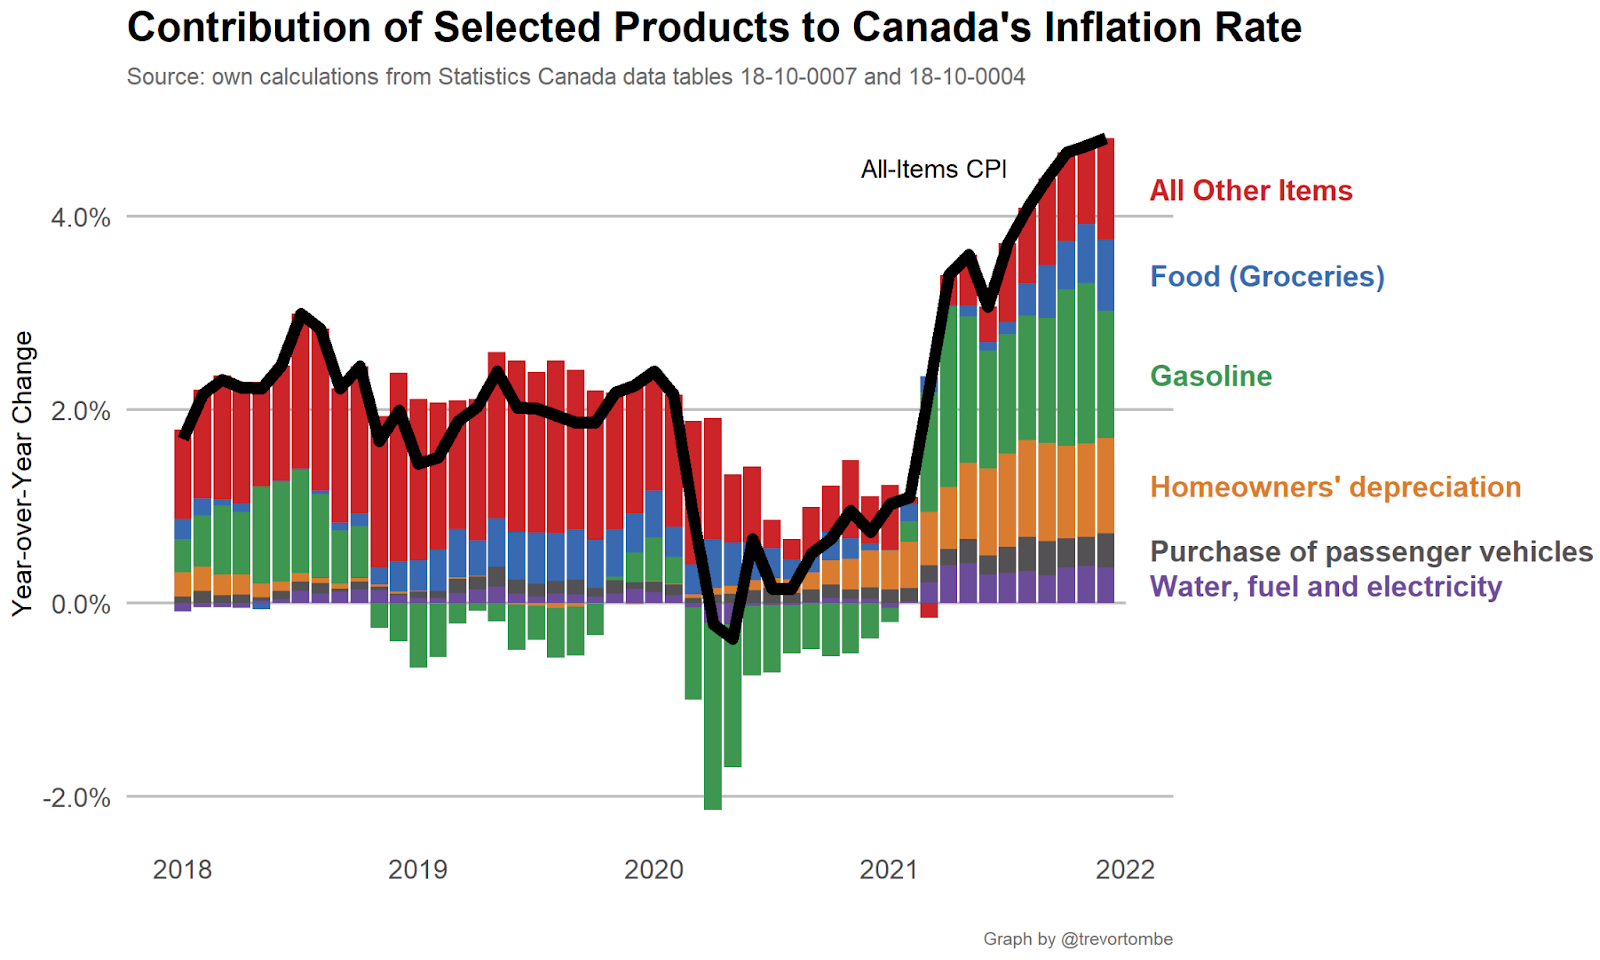
Combined, they account for roughly 9 percent of the overall basket of goods and services in the consumer price index. But—and this is the surprising part—they account for a clear majority of the increase in measured inflation recently. Let that sink in.
Had just these two specific items not increased in price over the past year, Canada’s inflation rate would have been close to normal. With just two items driving the overall average, it’s worth understanding what’s going on with each.
Gasoline
The story here is simple: high global oil prices have increased gasoline prices. Not surprising, since crude oil is the most important input into making gasoline. Below you can see the near-perfect relationship between global crude prices and gasoline’s contribution to CPI. In recent months, roughly a point and a half of Canada’s overall inflation is from this one fact alone.
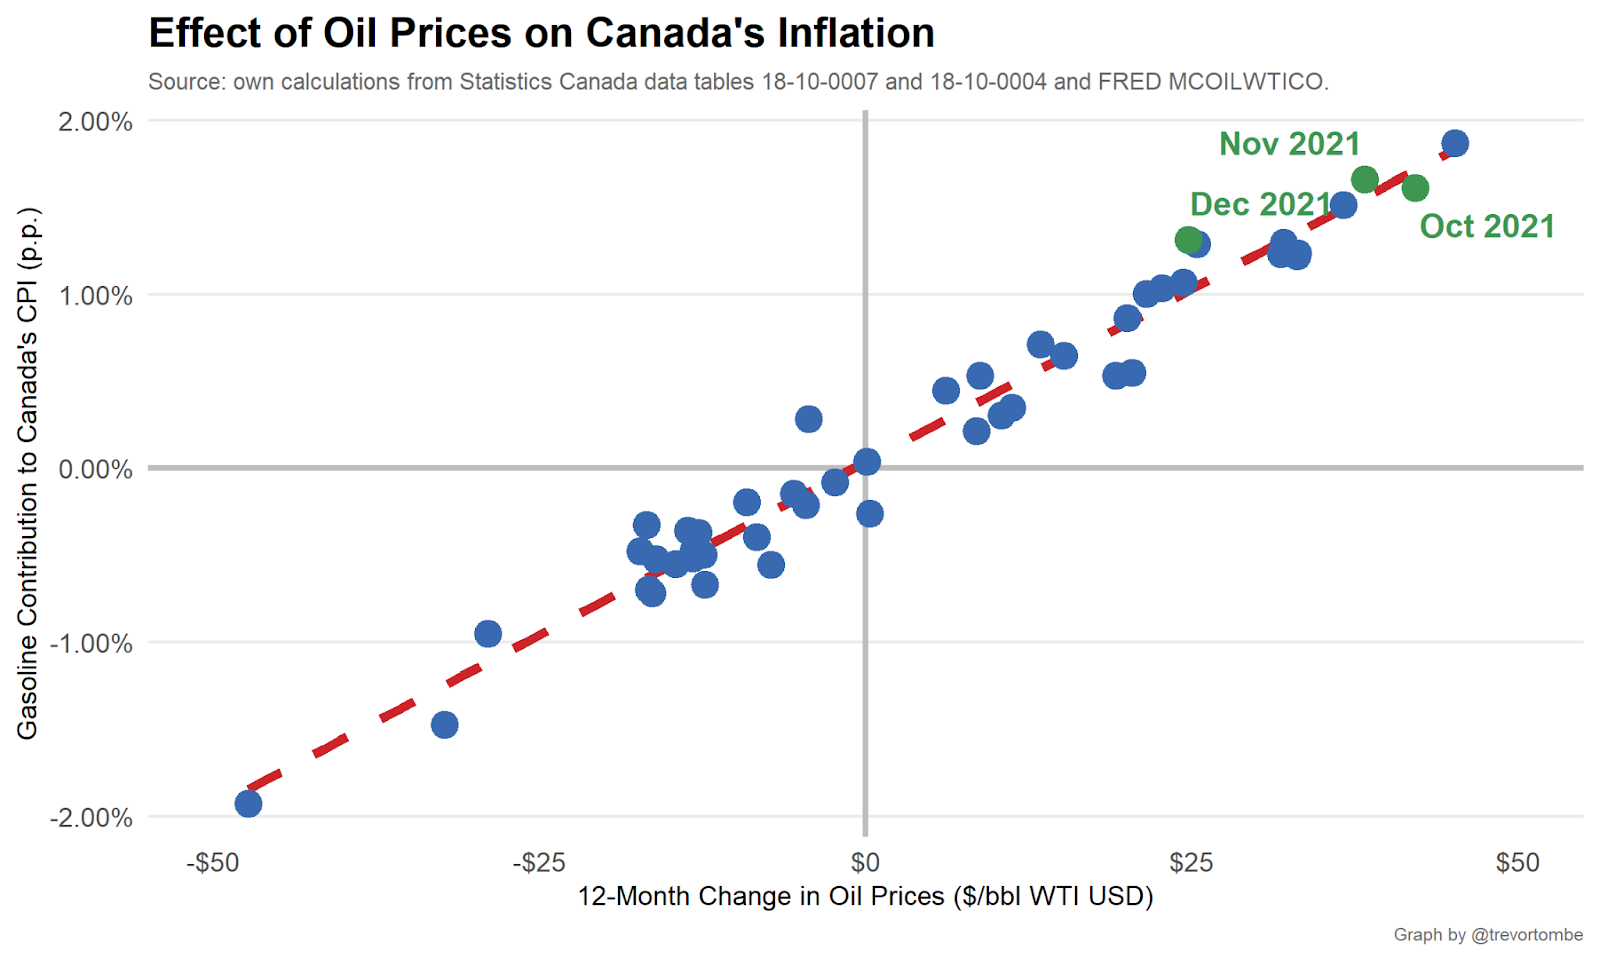
High oil prices partly reflect OPEC’s slow pace of normalizing their production after cuts earlier in the pandemic. Another part is the strong pace of global economic recovery (a good thing!). Canadian domestic policy is not particularly relevant.
Either way, Canada’s economy on average benefits from high oil prices. In fact, recent research by economists Jared Carbone and (my UCalgary colleague) Ken McKenzie suggests that all provinces except New Brunswick benefit. And it’s the main reason why Alberta may be able to balance its books this year.
This doesn’t mean all individuals are better off. No doubt higher prices at the pump are a strain for many—especially in the short-term. But this is an important piece of context around this specific driver of inflation in Canada.
Homeowners’ depreciation
The second item—homeowners’ depreciation—is a fascinating one.
Unlike all other items within our measure of inflation, this one is not an actual out-of-pocket spending item. It’s a conceptual object. It’s a crude estimate of how much of one’s home “wears out” each year.
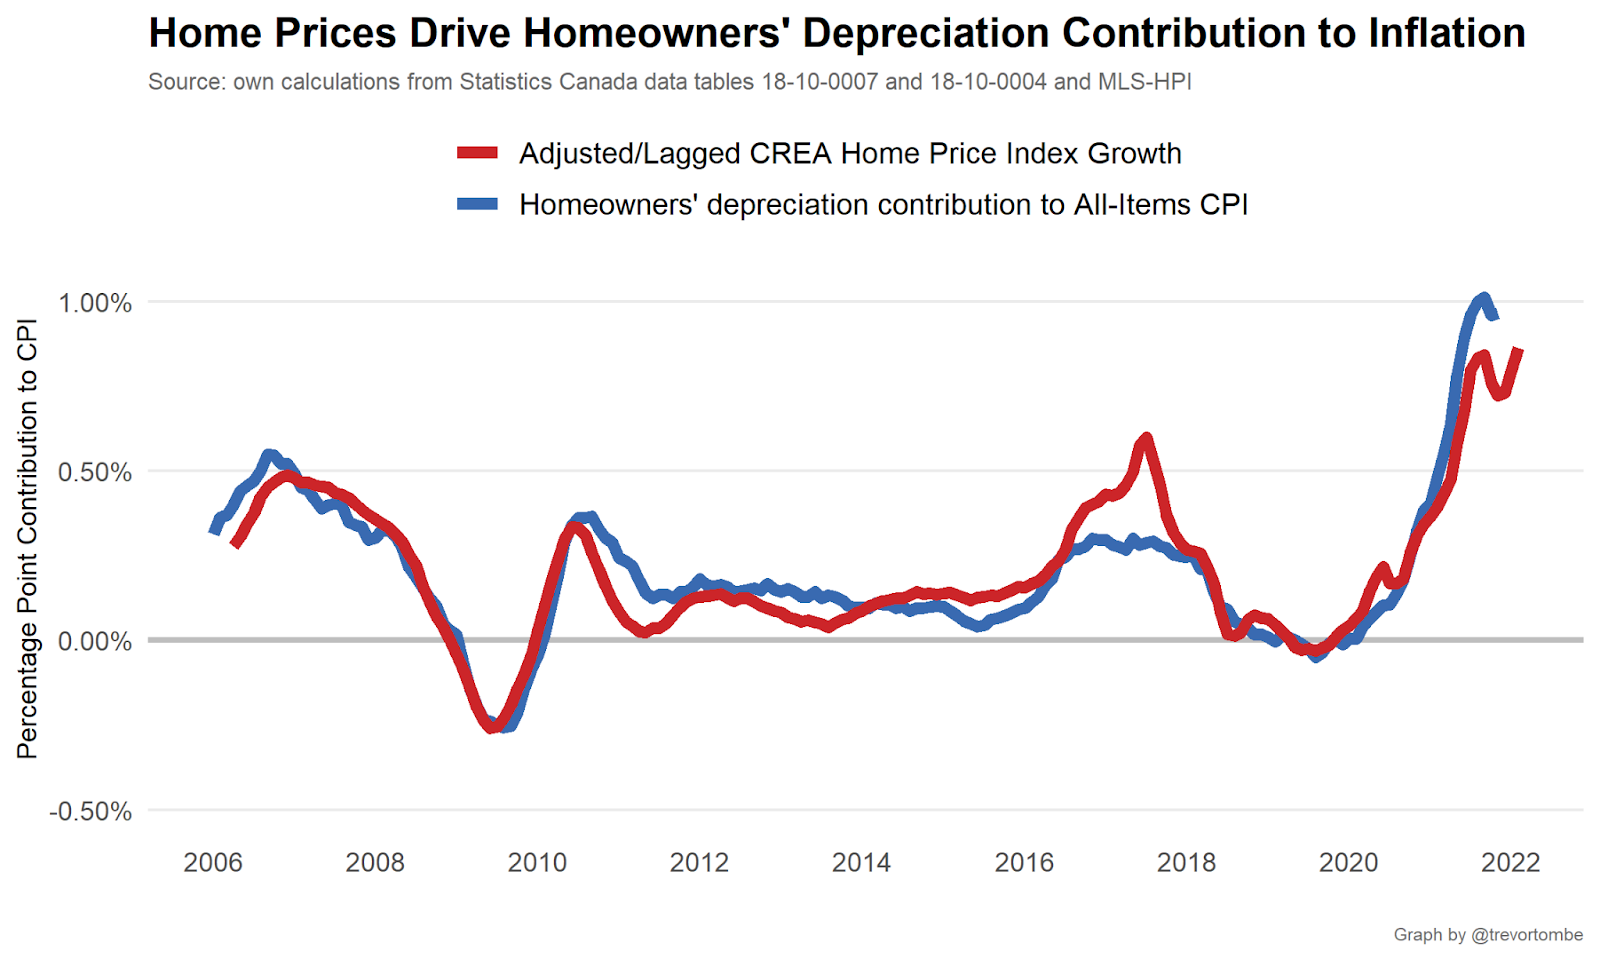
Currently, Statistics Canada presumes 1.5 percent of a home’s value depreciates each year. And this mechanically means that when home values increase, so too will measured depreciation—1.5 percent of a larger number is, after all, a larger number.
There are some details under the hood, of course, but the intuition should be clear. I illustrate the relationship between home prices and depreciation’s contribution to inflation below.
Why home values are increasing is a difficult question to answer. But it’s not unique to Canada. Nearly all developed economies are experiencing a significant surge. As of Q2 2021 (the latest quarter with internationally comparable prices), the average housing prices in OECD countries were over 18 percent higher than two years earlier. In Canada, the increase over this same period was 20 percent. In Australia, 24 percent. And in the United States, 25 percent! Home prices, to quote a headline from The Economist magazine, are “going ballistic”. There are many potential factors behind this, but there is much we don’t yet understand.
Importantly, the higher cost of buying a home doesn’t itself directly factor into the CPI, nor does the cost of buying other assets like stocks or bonds. Buying a home instead of renting one is an investment decision, rather than consumption. And price increases are a capital gain for most (since two-thirds of families own rather than rent). Home prices in Canada only indirectly matter, due to the way in which Statistics Canada estimates “depreciation”.
(As an aside, countries vary in how they treat housing in the consumer price index. It’s not easy. Some exclude owned accommodation completely. Others look only at actual out-of-pocket spending. Others impute the rental value of homes. And others, like Canada, look at both real and imputed costs of ownership. Each approach has strengths and weaknesses.)
Concluding thoughts
None of this means that inflation doesn’t matter or that many individuals and families aren’t being squeezed. Some are better off than they were last year. Some are worse. And depending on what you buy, you’re exposed to price changes differently than others are. Statistics Canada’s Personal Inflation Calculator can be accessed here (my personal inflation rate appears to be around 5.1 percent). Discussing policy options to improve affordability and help those in need does matter.
And that’s precisely why it’s important to understand what’s driving overall inflation. This not only informs where we should direct our scarce attention but also helps signal where inflation might be headed. Since Canada’s inflation story is more about gasoline and home prices than anything else, if home prices do not continue their rapid rise and if gasoline prices also stabilize, then inflation may fall back to normal later this year.
Uncertainty is high, of course, and unforeseen developments will surely arise. But if and when they do, the details will matter.
Recommended for You

Ginny Roth: J.D. Vance, Pierre Poilievre, and how they slice their economic pie

Trevor Tombe: Canadians are paying billions in hidden taxes on new homes

Stephen Staley: Widespread deregulation is Canada’s golden ticket for economic growth

Stephen Staley: Canada’s economy is trapped in a tangled web of over-regulation. Growth and prosperity demands we cut ourselves free