
As the federal Parliament returned this week, there’s been a renewed debate about the Trudeau government’s economic record and the state of Canada’s economy relative to its peers. A comprehensive evaluation—including key metrics such as investment, income growth, and living standards—demonstrates an overall record of economic stagnation.
Recall that the Trudeau government was first elected in 2015 based in part on a new approach to government policy, which promised to boost Canada’s economy through a combination of temporary borrowing to finance a limited increase in government spending, lower taxes for most Canadians (except higher-income earners), and a more active approach to economic development. After eight years in office, the government has not only failed to live up to its promises to reduce taxes and limit borrowing, but its overall mix of policies has contributed to the country’s poor economic outcomes.

A policy agenda of rising spending, taxes, deficits, and debt
Start with program spending. Since taking office, the Trudeau government has greatly increased federal spending (excluding interest costs) from $256.3 billion in 2014-15 (the year before it took office) to $448.2 billion in 2022-23—an increase of 74.9 percent. After adjusting for inflation, the Trudeau government has recorded the five highest years of federal spending per person in Canadian history. Put differently, it has spent significantly more than past governments did during the Second World War or the 2008 financial crisis or other emergencies in the country’s history. Post-COVID levels of spending have still not returned to pre-COVID levels.
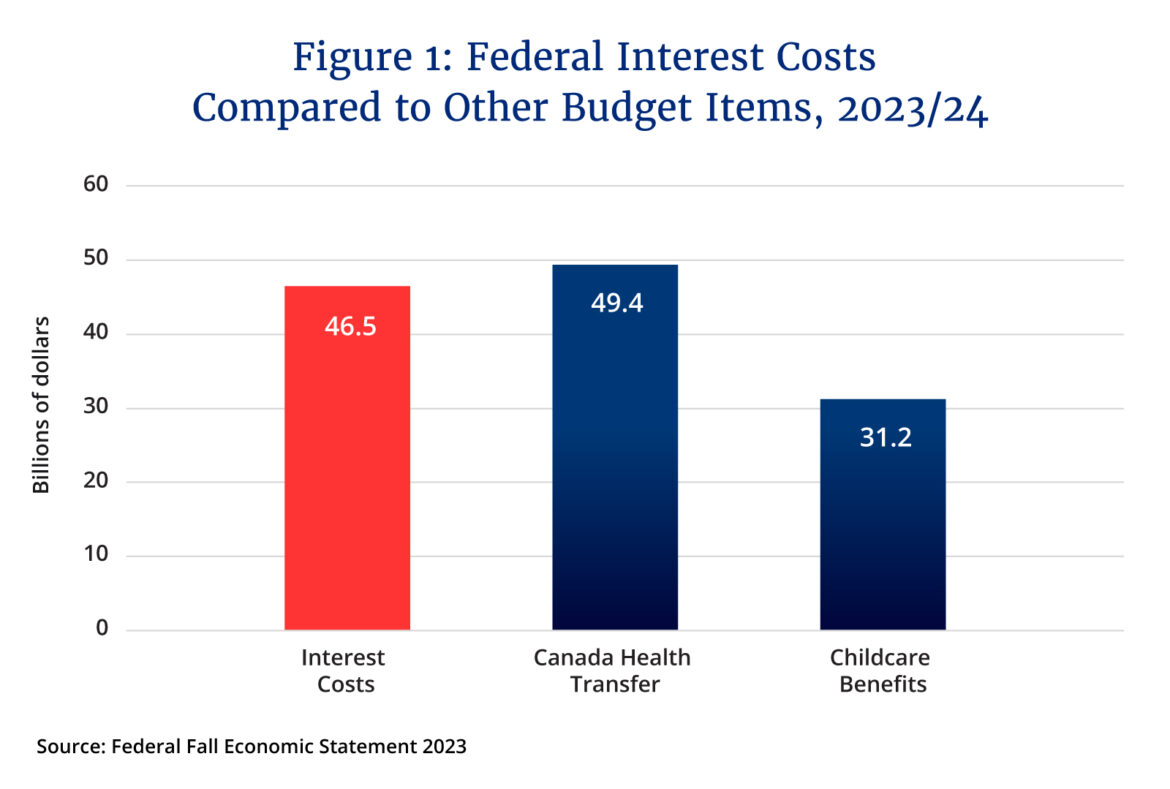
Most of this spending growth has been deficit-financed. The government has recorded eight consecutive deficits and its latest fiscal projections anticipate more deficits for at least the next six years. This deficit spending has come with a big cost. Not only has it led to the accumulation of nearly $1 trillion in new federal debt, but it’s come with rising interest payments that are paid through tax dollars. Federal debt servicing payments currently stand at $46.5 billion in 2023-24 which amounts to more than one in every ten dollars of federal revenue.
For perspective, federal interest payments now represent more than total spending on childcare benefits (Canada Child Benefit and $10-a-day daycare) and almost the same amount as Ottawa provides the provinces through the Canada Health Transfer (figure 1).
Tax increases have also been used to finance growing federal spending. In 2016, the federal government increased the top personal income tax from 29 percent to 33 percent which now means that the combined top personal income tax rate (federal and provincial) exceeds 50 percent in eight provinces (with the remaining provinces only slightly below 50 percent). In 2022, Canada had the fifth highest top tax rate out of 38 OECD countries.
And while the Trudeau government reduced the second lowest personal income tax rate, it has also eliminated several tax credits that have offset the tax savings. According to our estimates, the net effect is that 86 percent of middle-income families are paying higher personal income taxes than they did before.
Lower-income families have also seen an increase in their tax bills. Specifically, 60 percent of families who are in the bottom 20 percent of earners are paying more in personal income taxes following the changes made by the current government.
An economy in stagnation
The political debate cited earlier is fundamentally at its core about whether the Trudeau government’s policy agenda has produced positive or negative outcomes. The evidence is pretty clear: it has led to stagnation rather than greater prosperity for Canadians.
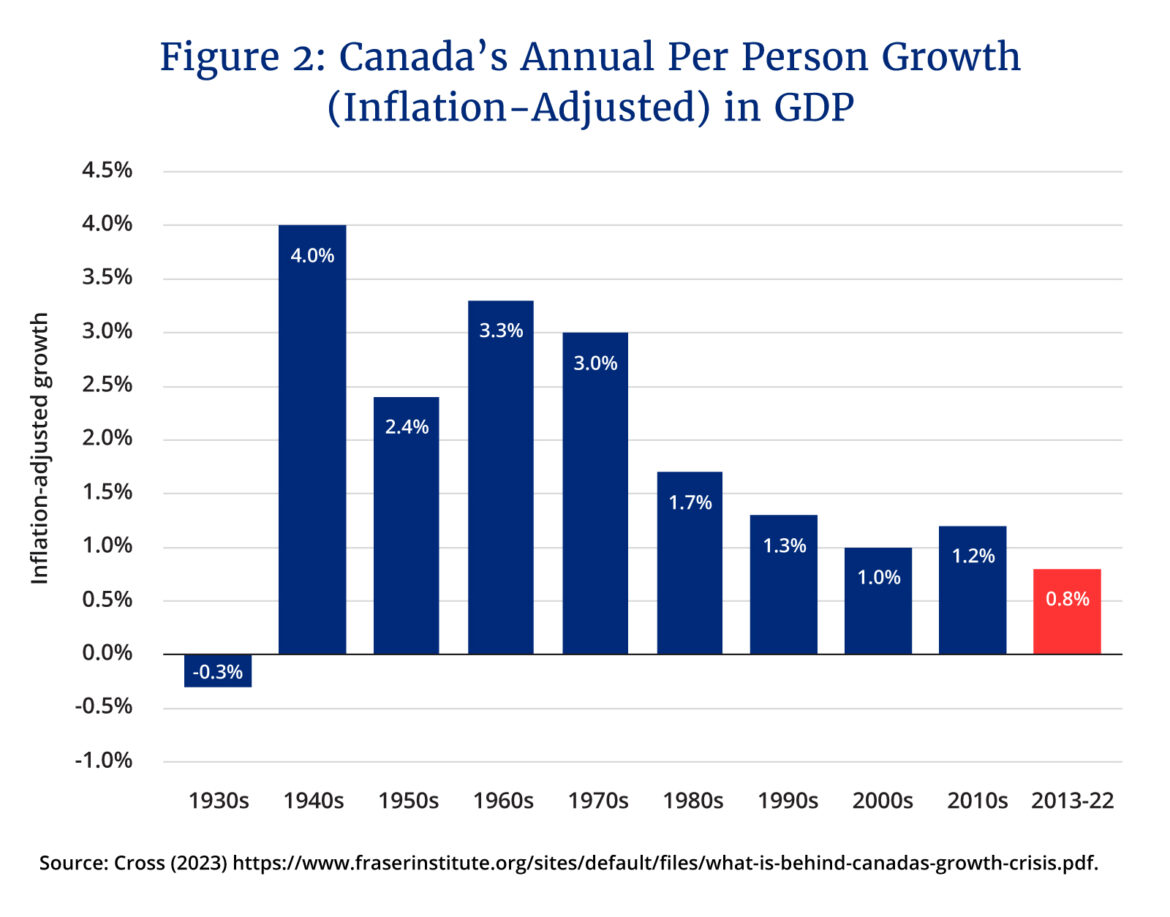
The broadest measure of living standards is GDP per person (adjusted for inflation over time), which calculates the total value of all goods and services produced in the economy in a given year on a per-person basis. In the pre-pandemic period between 2016 and 2019, growth in per-person GDP (inflation-adjusted) was an anemic 0.9 percent. One study in fact found that Canada’s per-person GDP growth from 2013 to 2022 (0.8 percent) was the weakest on record since the 1930s (figure 2).
Since the Trudeau government was first elected there’s been 32 quarters with data on per-person GDP growth (up to the third quarter of 2023). For thirteen of those quarters, Canada experienced negative per-person GDP growth adjusted for inflation, including before and after the pandemic. Moreover, the latest numbers show that we haven’t recovered to peak pre-pandemic levels—inflation-adjusted per person GDP in 2023 was still 2.2 percent below the levels in the second quarter of 2019.
Overall, inflation-adjusted GDP per person has only grown by 1.9 percent since 2015. The United States, by contrast, grew by 14.7 percent during the same timeframe.
Prospects for the future, given current policies, are not encouraging. Not only are we falling behind our most important trading partner, but the Organization for Economic Cooperation and Development (OECD) projects that Canada will record the lowest rate of per-person GDP growth among 32 advanced economies from 2020 to 2030 and from 2030 to 2060. Countries such as Estonia, South Korea, and New Zealand are expected to vault past Canada and achieve higher living standards by 2060.
A key source of this disappointing performance on living standards is our declining business investment. Business investment (inflation-adjusted), excluding residential construction, declined by 16.3 percent between 2014 and 2022, or by 1.9 percent on average annually.
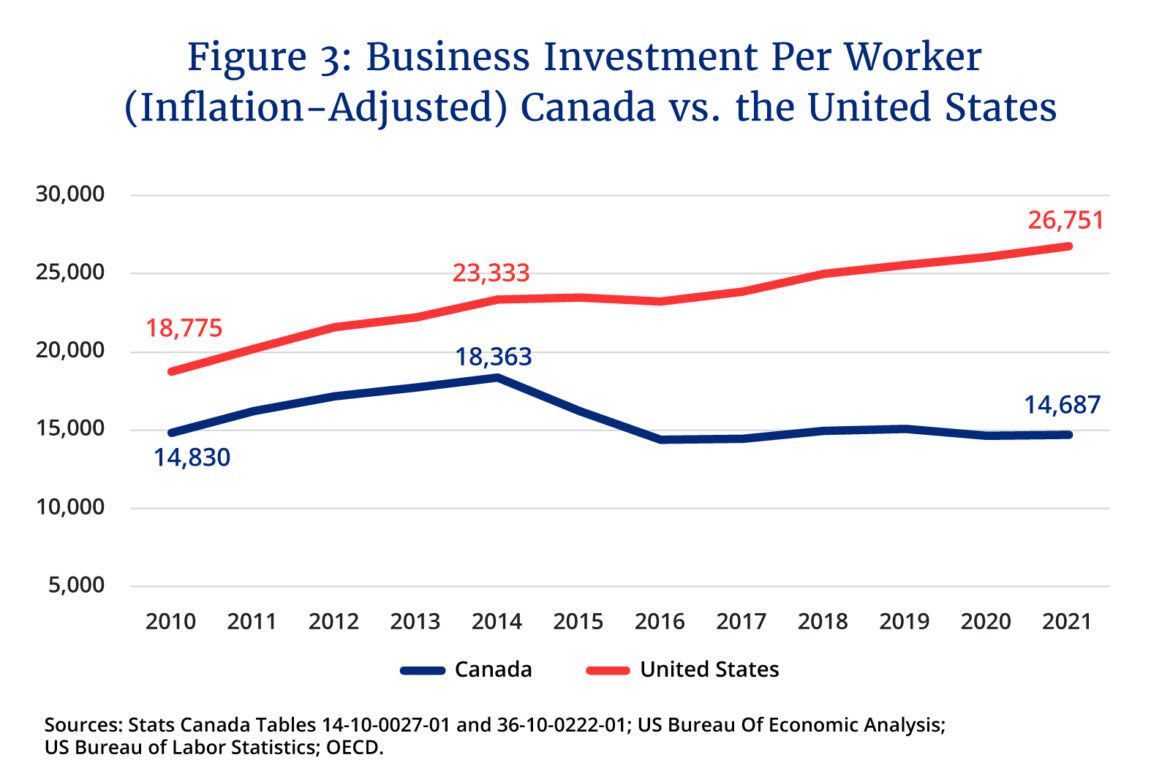
One way to think about the consequences of declining business investment is to compare investment per worker between Canada and the U.S. According to a 2023 study, between 2014 and 2021, business investment per worker (inflation-adjusted, excluding residential construction) decreased by $3,676 (to $14,687) in Canada compared to growth of $3,418 (to $26,751) in the U.S. (figure 3). Put differently, in 2014, Canadian businesses invested 79 cents per worker for every dollar invested in the United States. By 2021, that level of investment had declined to just 55 cents per worker.
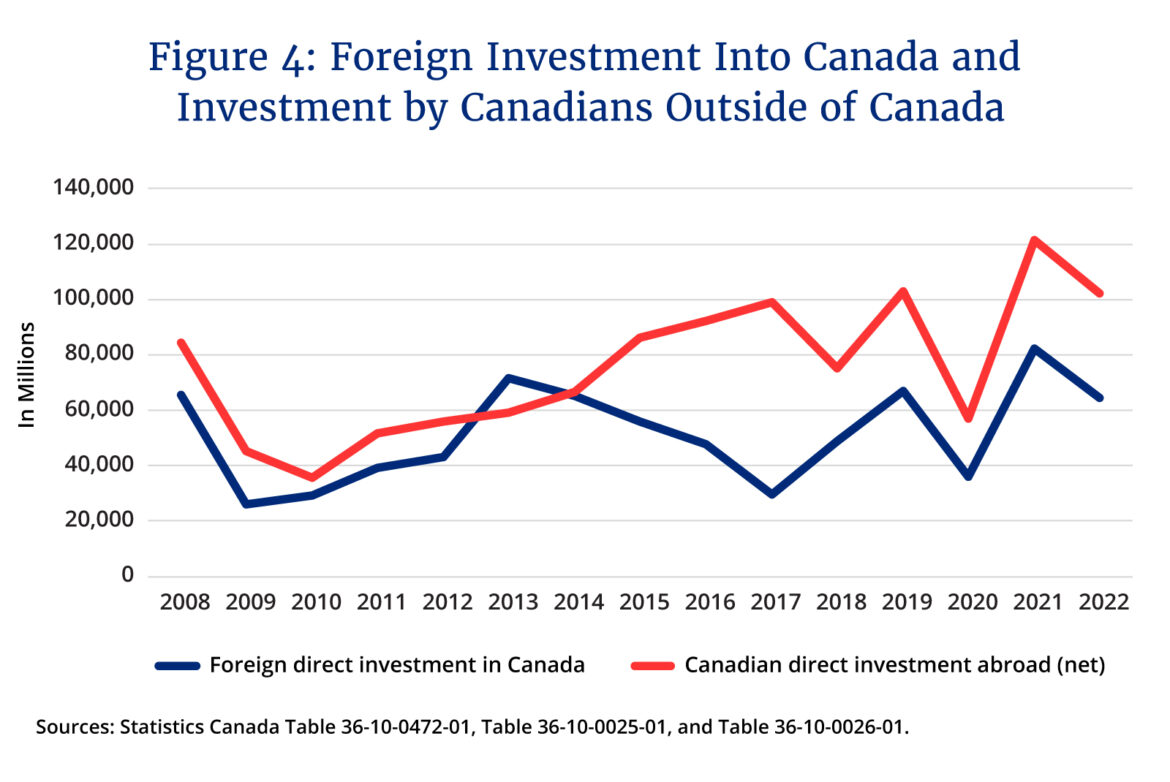
The flow of funds into Canada by foreigners compared to the outflow of investment by Canadians to other countries tells a similar story. In 2008, the two levels were roughly comparable—$65.7 billion in foreign direct investment in Canada versus $84.6 billion in investment by Canadians outside of the country. A big shift started in 2015 (figure 4) and by 2022, the foreign direct investment in Canada ($64.6 billion) was significantly lower than Canadian investment abroad ($102.3 billion).
There are various explanations for the decline in business investment. Some may reflect broader global developments but many stem from government policy itself.
Since 2015, the federal government has implemented a series of policies that have cumulatively harmed the country’s investment environment—particularly for the energy sector. Bill C-69, which instituted a complex and burdensome assessment process for major infrastructure projects, and, Bill C-48, which prohibits producers from shipping oil or natural gas from British Columbia’s northern coast, are two examples.
These policy choices have had tangible negative effects on projects such as the Northern Gateway pipeline, the Energy East pipeline, the Mackenzie Valley pipeline, Teck Resources’ proposed Frontier oilsands mine in Alberta, and Kinder Morgan’s Trans Mountain pipeline. It’s no surprise therefore that investment in the Canadian oil and gas sector fell from $95.5 billion in 2014 to $35.1 billion in 2023 (adjusted for inflation)—a drop of 63.2 percent.
More recent policy proposals, including forthcoming regulations on electricity production, clean-fuel standards, single-use plastics, and a hard cap on GHG emissions in the oil and gas sector, will only further weaken investment in Canada. While there are many contributing factors behind energy investment, Canada’s unattractive policy environment must be understood as a major deterrent.
In the “Canada-US Energy Sector Competitiveness Survey 2023,” senior executives in Canada’s petroleum industry pointed to uncertainty regarding environmental regulations, as well as duplicative and inconsistent regulations, as deterrents to investment. Indeed, 68 percent of respondents for Canada are deterred by the uncertainty concerning environmental regulations, and 54 percent of respondents are discouraged by regulatory duplication and inconsistencies. Less than half of American respondents were deterred by those same factors in their jurisdictions.
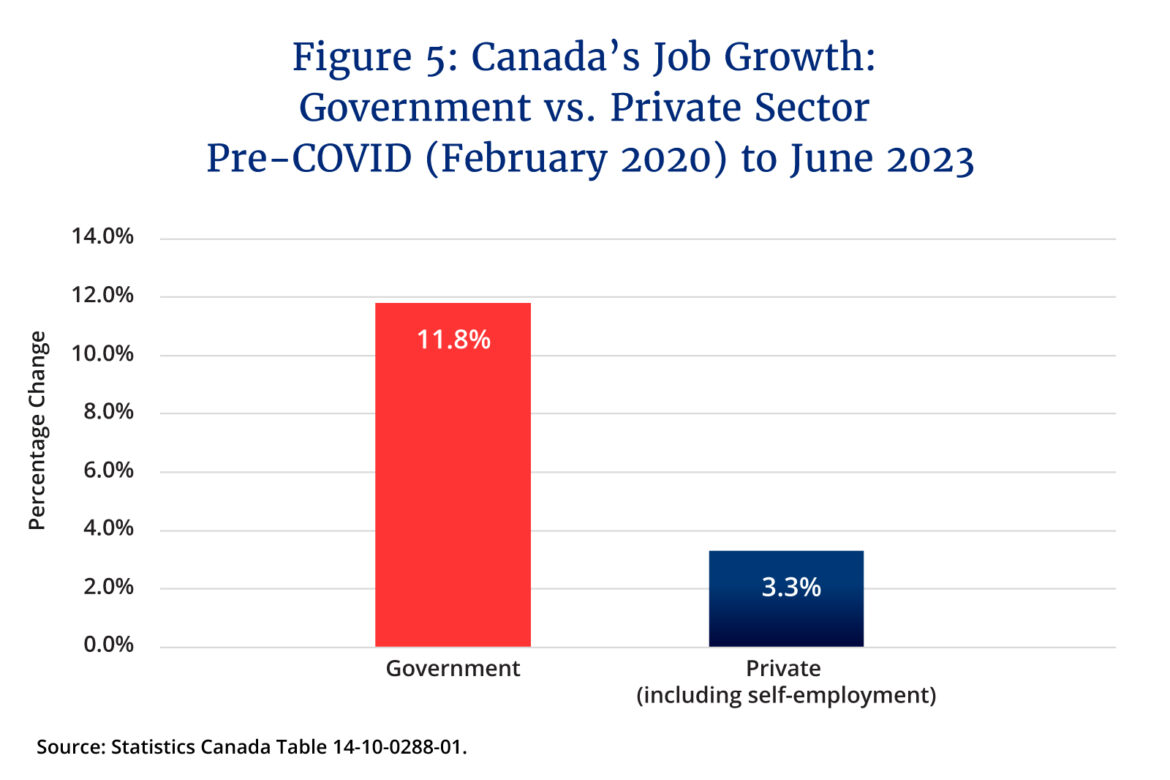
As for Canada’s labour market, the top-line numbers hide some concerning trends. For example, between February 2020 (when the pandemic began) and June 2023, private-sector job creation (net) was fairly weak at 3.3 percent compared to 11.8 percent job growth in the government sector (figure 5).
Another concern is the labour force participation rate is declining because of the country’s aging population. Since 2014, Canada’s labour force participation rate has decreased from 66.3 percent to 65.6 percent. As the population ages, Canada’s labour force will continue to shrink and cause the unemployment rate to be lower than it otherwise would be with stable participation rates. For perspective, there are 3.0 million Canadians aged 15 to 24 in the labour force compared to 3.5 million Canadians aged 55 to 64, which represents a ratio of 0.87—down from 0.97 in 2014.
Declining participation rates, rising government sector employment, and weak private sector job growth do not equate to strong labour market performance including the conditions for sustainable, market-driven income gains.
As an example, median total income (inflation-adjusted) for couples with children grew at a compound annual rate of 1.3 percent between 2015 and 2021 (latest year of available data). But if one backs out transfers from government, income gains in the form of employment-based wages and salaries are much weaker. In 2014, government transfers accounted for 6.7 percent of total income for couples with children. In 2021, they represented 11.8 percent of their total income (figure 6).
It must be remembered that an increase in government transfers has been financed by government debt. It leads to basic questions about its sustainability since, presumably, the resulting public debt increases will need to be paid for through future tax increases or spending reductions at a later date.
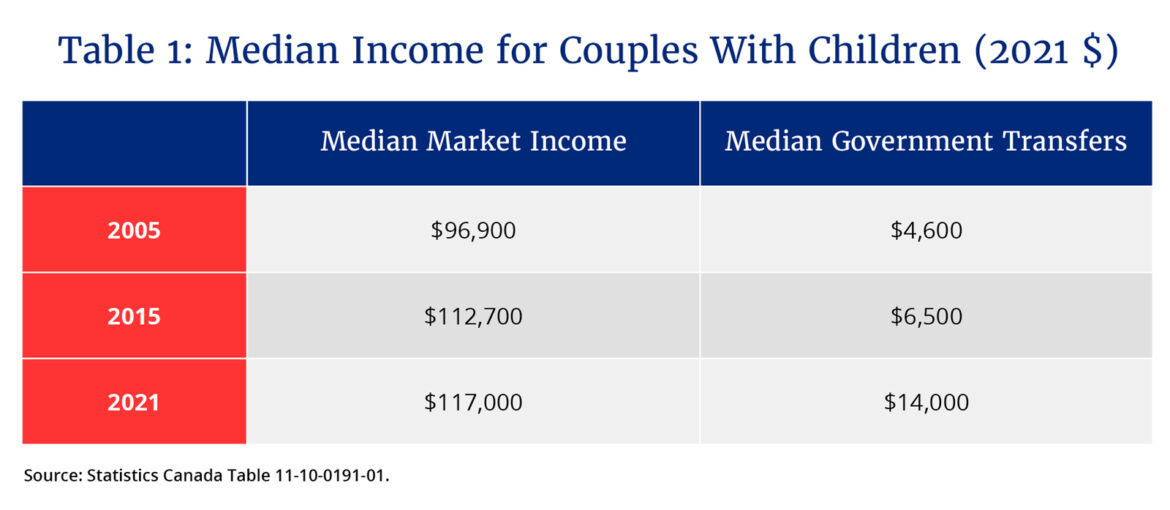
A better measure of income growth for Canadian families therefore is to look at the income of households before taxes and government transfers, referred to as market income. As shown in the table below, median market income for couples with children has grown by a meagre compound annual rate of 0.6 percent between 2015 and 2021. For perspective, the growth rate in median market income from 2005 to 2014 was almost triple (1.7 percent). As another point of comparison, government transfers for couples with children have grown at a compound annual rate of 13.6 percent during the Trudeau government’s time in office.
Median employment incomes for individuals in Canada trail our American counterparts by a significant margin. In an analysis that compares 141 metropolitan areas in Canada and the U.S., the authors found only two Canadian cities in the top half of the overall rankings. The performance of Toronto is particularly concerning, as the median employment income in Canada’s most populous metropolitan area ranked 127th among the 141 jurisdictions analyzed. Vancouver and Montreal ranked 131st and 134th, respectively.
Median employment income for Torontonians and Montrealers is nearly $20,000 below those of individuals in the New York/New Jersey metropolitan area, whereas Vancouverites trail Seattle residents by nearly $24,000.
The upshot of all of these facts and figures is that Canada’s economy across a wide range of metrics—including GDP growth, business investment, and incomes—is stagnant or even declining and that government policy has played a key role in these disappointing outcomes.
The first step in solving any problem is to admit that there is a problem. The evidence is clear: it’s time for federal policymakers to quit pretending we’re on the right track.