
The notion of a “lost decade” has loomed over the federal election campaign which now finds itself in the final weekend before Monday’s vote.
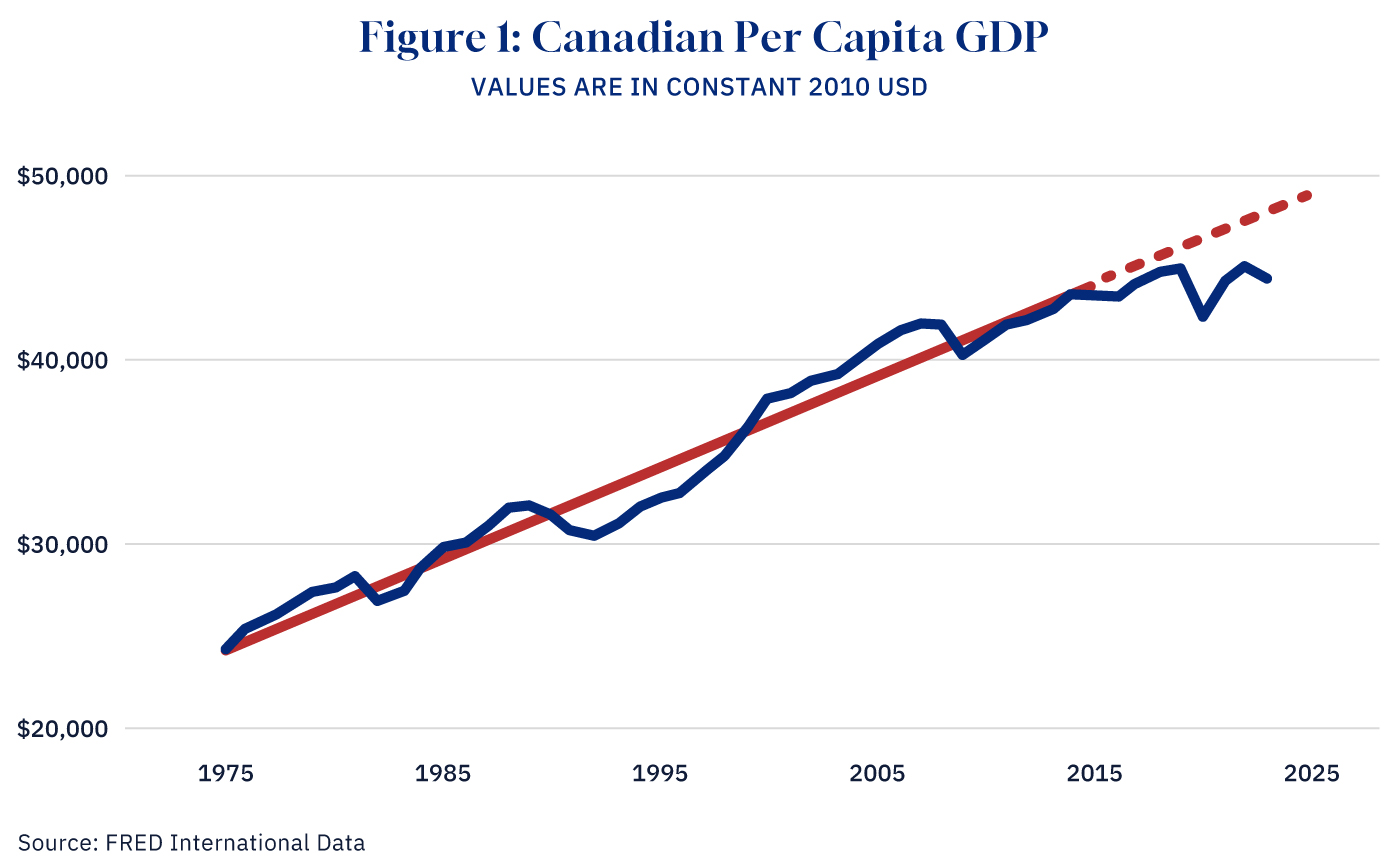
The basic insight is reflected in Figure 1 below. The solid black line shows per capita GDP on an inflation-adjusted basis. The solid red line shows the average growth trend for 1975–2015, and the dashed red line shows projected Canadian per capita GDP had the 1975–2015 trend continued since 2015. As one can see, Canadians are effectively no better off today than they were in 2015, with only a cumulative 2 percent increase since 2015 compared to 17 percent in the United States.
Any talk of a lost decade implicitly—and sometimes explicitly—references the two rich countries that have recently experienced a lost decade and counting. Japan’s lost decade began in 1991 and continues to this day. Italy’s economic malaise began later, with a less clear timestamp, but similarly still continues. Lost decades aren’t so easy to escape, it seems.
What distinguishes Canada’s lost decade from Japan’s and Italy’s is that we haven’t just experienced economic stagnation. It’s that we’ve matched flat-lining (or even declining) living standards with skyrocketing housing prices. The interrelationship between the two makes the Canadian experience unique, and the need for policy change so imperative.
Figure 2 illustrates the divergence of Canadians’ personal economy with rising housing prices relative to Japan and Italy. Using a real house price index with each country’s 2005 home price benchmarked to 100 to account for inflation, we can easily see changes within each country over time, and also compare the trends in changing home prices between these countries.
The black vertical line in 1991 is the onset of Japan’s lost decade, heralded by the bursting of the Japanese asset price bubble. Italy’s malaise lacks an obvious precipitating event like Japan’s. While some have suggested Italy’s lost decade began as early as the 1990s, considering the country experienced 10 percent economic growth in the decade leading up to the 2008 global financial crisis, it seems inaccurate to compare such relatively robust growth to Canada’s paltry 2 percent per capita growth since 2015. A vertical gray line marks the global financial crisis, since Italy has yet to recover economically to its pre-crisis levels.
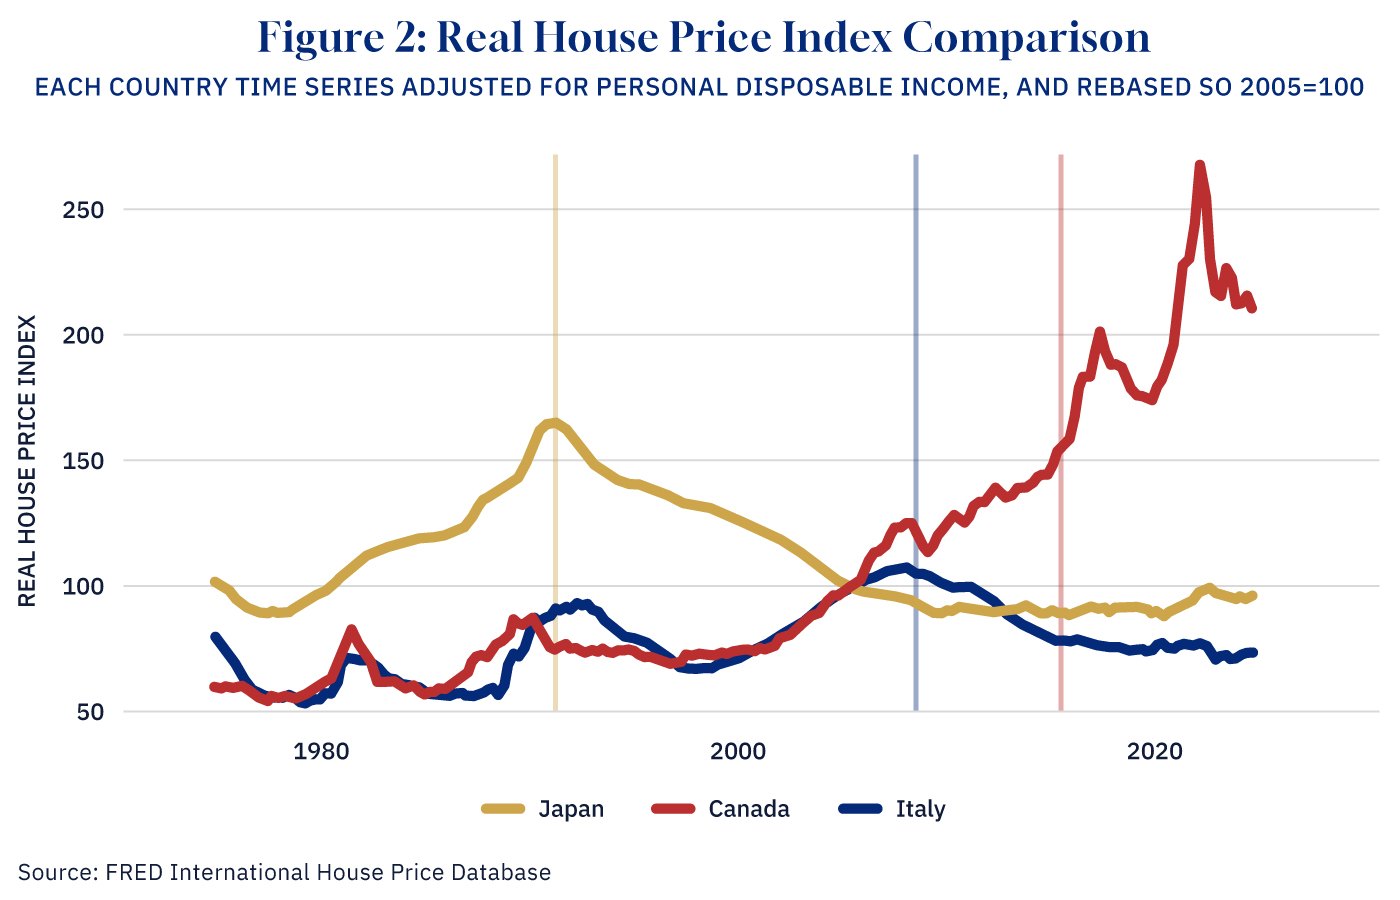
Like Italy, Canada lacks a precise moment that ushered in a lost decade. It reflects a confluence of factors starting in 2015 (which marked the election of the Trudeau government) with obvious implications for Canadian public policy and economic outcomes, as illustrated here by the vertical red line.
The plotted lines in the figure above are adjusted for inflation (specifically changes in personal consumption expenditures) and benchmarked to each country’s own 2005 prices. That means the data doesn’t allow us to precisely compare them to or infer the nominal price of Canadian homes.
The data does, however, allow us to say that at the end of Japan’s first lost decade, real housing prices in Japan were 25 percent lower than at its onset. A decade after the 2008 crisis, Italy’s real housing prices were almost 30 percent lower than they were before the crisis. In Canada, by contrast, at the end of 2024 (the last quarter for which we have data), real home prices remain markedly higher than they were 10 years ago at the onset of our lost decade.
While eight Japanese and six Italian prime ministers may have led their fellow countrymen through their respective first decade of economic stagnation, they did not also govern over an era where young Japanese and Italian adults making ostensibly upper-middle class incomes found themselves with no realistic option to ever own their own home.

Consider for instance that the cost of housing now accounts for 60 percent of the median annual income in Canada. And that’s the average across the entire country. In Toronto and Vancouver, that number jumps.
This unique dynamic between stagnant living standards and rising housing prices is explained in part by the unprecedented increase in immigration over the past several years. In 2023, for instance, approximately one out of every 40 people in the country was an international student. In the same year, Canada’s population growth was twice the rate of Japan’s entire lost decade combined.
Since the third quarter of 2015, Canada has added over five million new residents, growing over 16 percent over the past decade. To frame it a bit differently: this is the equivalent to adding a new Montreal (1,600,000 people), Calgary (1,020,000), Ottawa (812,000), Edmonton (712,000), Winnipeg (632,000), and Vancouver (600,000) in just ten years. Adding another Halifax (500,000) every year is less than what Canada has been doing.
These outcomes aren’t an accident. They’re a consequence of public policy. And their effects are manifesting themselves in ways that may not even be obvious.
Consider fertility rates. While fertility rates have been dropping across the rich world, Italy and Japan have been extreme examples of this phenomenon. Canada increasingly moved in this direction, and now has surpassed both. Figure 3 plots the total fertility rate for each country. This time, however, the x-axis is not the calendar year, but thirty years: two decades before, and one decade after, the onset of each country’s lost decade (Japan’s line thus starts in 1971, Italy’s in 1988, and Canada’s in 1995). This allows us to easily observe each country’s trend both before and after its lost decade.
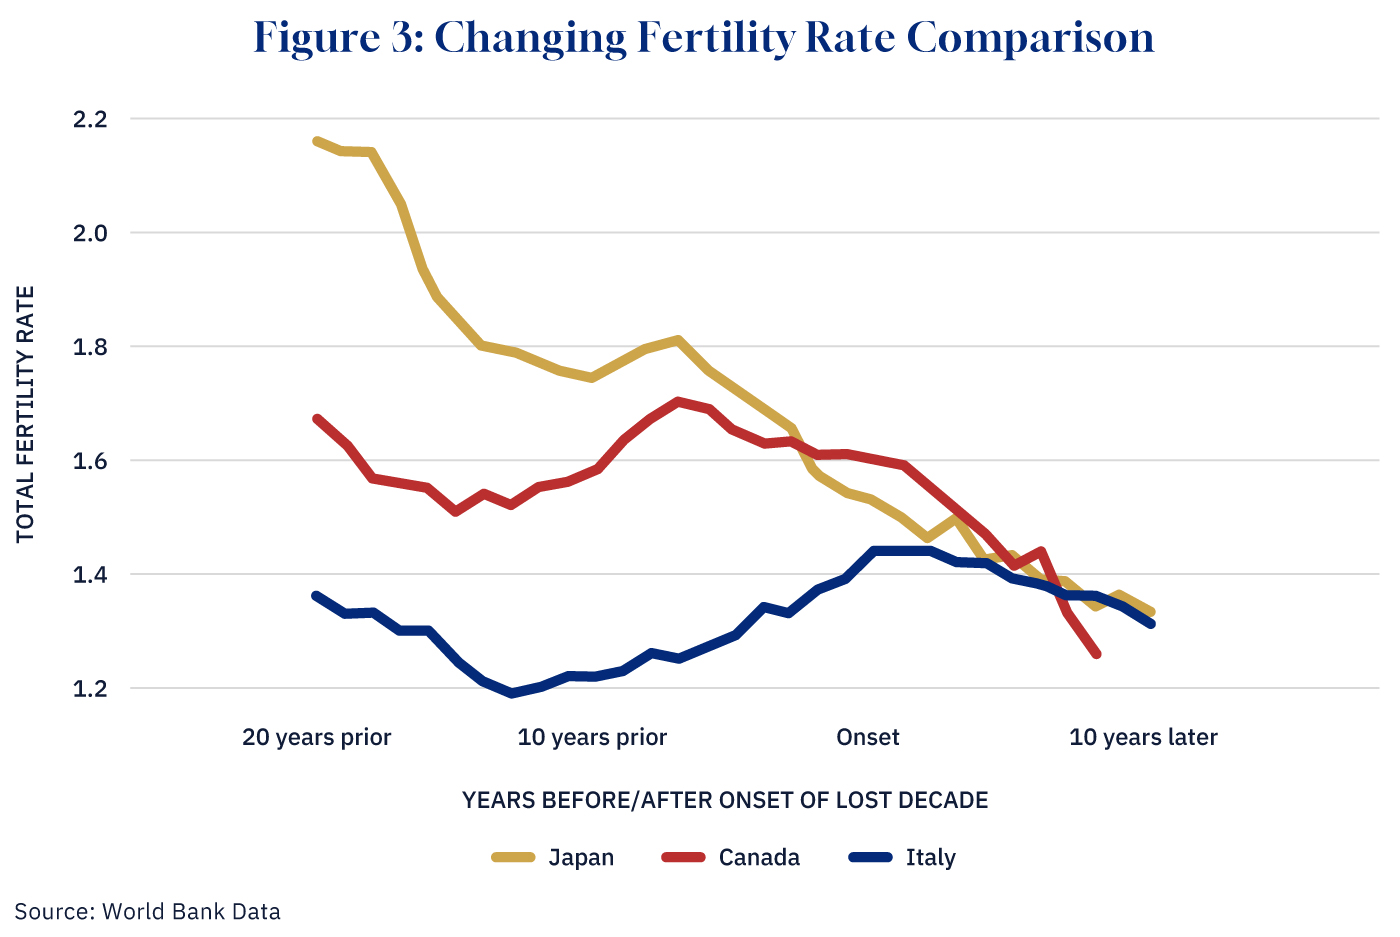
The results are startling. It is difficult to pin Japan’s or Italy’s fertility crisis on a lost decade. Japan’s fertility rate had been plummeting for 20 years prior to its lost decade. And in Italy, the low fertility rate was the same two decades prior to the lost decade as it was ten years after.
Canada, however, looks quite different. While fluctuating over time, in 2015 the fertility rate was about where it was in 1995, at 1.6 children per woman. This put us below replacement level, but not necessarily a crisis, and higher than Japan or Italy at the start of their lost decade. Canada’s decline in the decade since, however, far outpaces that in either Japan or Italy. Despite starting from a higher level, and only having data for the first eight years (the most recent fertility data is 2023), Canada’s fertility rate is below that of these two famously low countries, sitting at 1.26—well into crisis levels.
This data is consistent with what others have reported: it’s not that young Canadians don’t want children. It’s that so few Canadians can afford to have children, and that is because they cannot afford housing that would allow them to start families.
I’m not the first to notice that the housing crisis is fueling the population crisis. But, as Canadians go to the polls, they need to understand the unique particularities of Canada’s lost decade and how it’s manifesting itself beyond just conventional economic data. The combination of declining living standards, skyrocketing housing prices, and falling fertility to levels that no country has ever recovered from is indeed the “biggest crisis of our lifetimes.”