
Unlike our moribund real per capita GDP performance, the end of the pandemic and the associated economic rebound has seen Canadian unemployment rates return to pre-pandemic lows. Indeed, in early 2023, the unemployment rate had dropped as low as 5 percent, and even with the economic slowdown brought about by higher interest rates and robust population growth, at 6.1 percent, Canada’s unemployment rate in March 2024 remains historically low.
Over the last thirty years our unemployment rate has averaged closer to 8 percent. A factor in low unemployment rates is of course employment growth and while total employment is growing there are compositional features of that employment that are of concern. Public-sector employment is expanding faster than private-sector employment and self-employment.
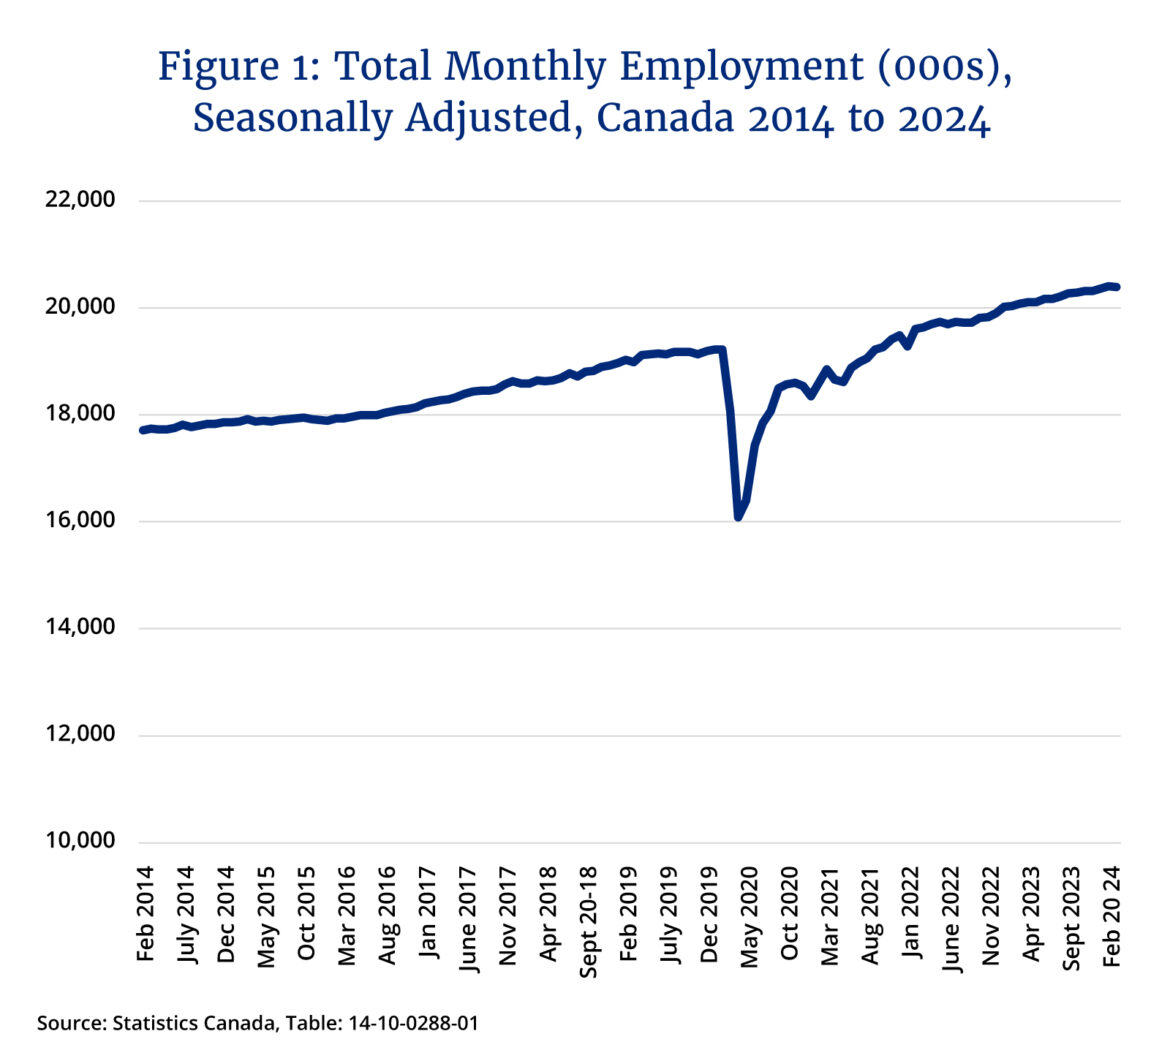
Figure 1 plots seasonally adjusted total monthly employment in Canada. Since January 2014, total employment has expanded by 15 percent, but the pandemic period was an important shock. In February 2020, total Canadian employment was 19.2 million people and dropped to 16.1 million in April 2020 as the economy shut down. Total employment then recovered as the economy gradually reopened and employment reached the pre-pandemic total of 19.2 million in September 2021 and stands at 20.4 million in March 2024. However, when the numbers are examined by class of worker, that is, public sector, private sector and self-employed, the story of growth is not uniform.
A decade ago, the private sector accounted for 65 percent of total employment, the public sector 20 percent, and self-employment 15 percent. At present, the private sector remains the largest employment class in Canada still accounting for 65 percent of employment, but the public sector is now at 22 percent and self-employment 13 percent. Indeed, since January 2014, public sector employment in Canada has expanded from 3.5 to 4.4 million workers—a 27 percent increase—private sector employment grew from 11.6 to 13.4 million—a 15 percent increase—and self-employment shrank by approximately half a percent.
Figure 2 plots public, private, and self-employment since January 2014 as an index setting employment for all three series equal to 100 in January 2014 to see trends over the 2014 to 2024 period. The picture is remarkable. From 2014 to the eve of the pandemic, all three sectors appear to have been growing pretty much in tandem. Indeed, from January 2014 to January 2020, public sector and private employment each expanded by approximately 9 percent while self-employment expanded by 7 percent. However, the period of the pandemic marks a shock to the economy with subsequent differential employment growth by sector.
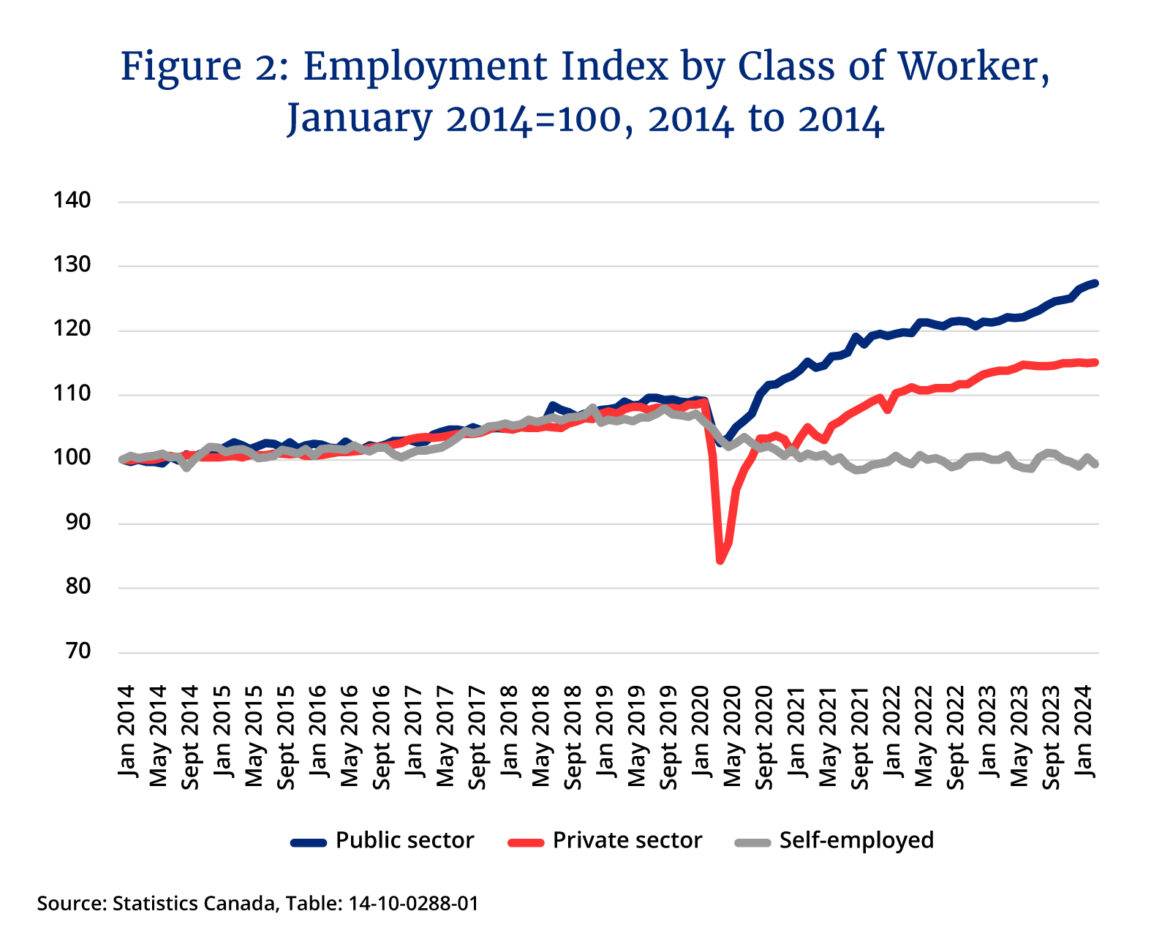
From January 2020 to the present, public-sector employment expanded nearly 17 percent going from 3.8 to 4.4 million. Private sector employment grew from 12.6 to 13.4 million, an increase of 6 percent. Self-employment fell from 2.8 to 2.6 million—a drop of 7 percent. In just the last year alone, the March-to-March increase in public sector employment was 202,000 jobs while the private sector added 141,000 and self-employment saw the loss of nearly 19,000 jobs. Overall, there has been a pronounced shift in employment growth towards the public sector.
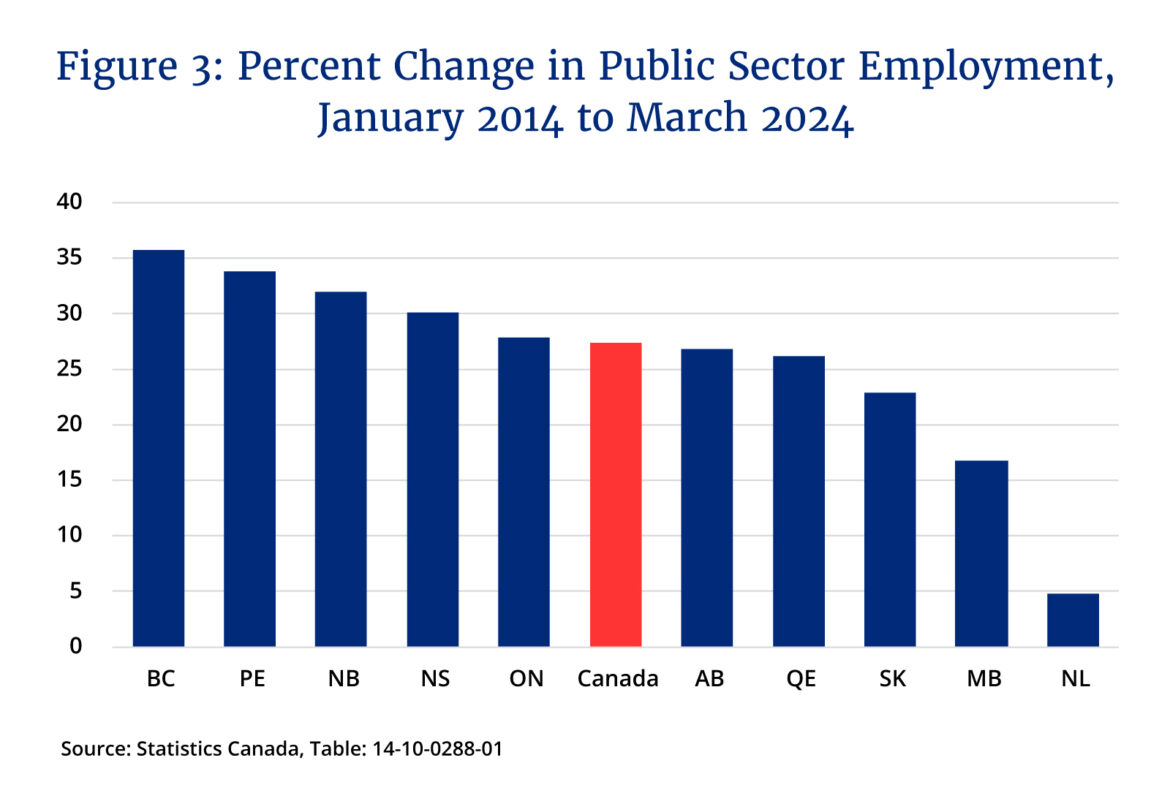
And the increase in public sector employment has occurred across the country, though with some variation as Figure 3 illustrates. Public sector employment growth over the last decade was the highest in British Columbia at 36 percent and the lowest in Newfoundland and Labrador at 5 percent. Along with Newfoundland and Labrador, Alberta, Quebec, Saskatchewan, and Manitoba saw their employment grow more slowly than the national rate.
As a share of total employment, public sector employment declined from a high of nearly 24 percent in the mid-1970s to a low of 19 percent by the early 21st century. It then resumed a gradual upward climb reaching nearly 20 percent by the eve of the pandemic and has since settled in at 22 percent. Private sector employment shares since the mid-1970s, pandemic notwithstanding, are more erratic fluctuating between 62 and 66 percent but averaging 65 percent. Self-employment rose from a 12 percent share in the mid-1970s to reach a peak in the late 1990s of just over 17 percent and then declined bringing the share to 15 percent by the pandemic’s eve and is now 13 percent.
So, what is going on here? The drop in self-employment means a drop in small businesses and entrepreneurship. The shock and restrictions of the pandemic were invariably a factor as many smaller and family or individually-run businesses decided to pack up shop for good. Some of these individuals may have gravitated towards public sector employment in a reverse flow to that of the mid-1990s when public sector retrenchment led to many former public servants becoming self-employed as independent contractors. More likely, given the aging labour force, they simply have decided to retire from the labour force permanently.

Are there implications for economic performance? It is probably not entirely coincidental that our expanding public sector in terms of both employment and GDP share is being accompanied by poor real per capita GDP growth. Indeed, this expansion of the public sector at the same time as rapid population growth and lagging business investment is a further drag on economic performance given evidence of the effects of public sector size on both economic growth and productivity. What may be underway is an example of the Baumol’s cost disease effect that explains how wages and employment in labour-intensive sectors increase relative to capital-intensive ones. To attract employment even in the absence of productivity gains, wages in low productivity sectors rise to compete workers away from capital-intensive higher productivity sectors. Government spending, detached from a profit motive and with its focus on labour-intensive services, is often disproportionately affected by Baumol’s cost disease.
As the spring 2024 federal budget approaches, an important signal will be whether the federal government will begin to address this issue within its own public service. In 2014, there were 257,138 federal public servants (both core public administration and separate agencies). By 2023, there were 357,247 federal public servants representing a decade increase of 39 percent eclipsing both national and provincial public sector employment growth rates. Given that the federal government does not provide either health or education services, nor has it been interested in funding a larger defence establishment, it begs the question: what is the actual demand for this employment, and what is its value-add?