DeepDives is a bi-weekly essay series exploring key issues related to the economy. The goal of the series is to provide Hub readers with original analysis of the economic trends and ideas that are shaping this high-stakes moment for Canadian productivity, prosperity, and economic well-being. The series features the writing of leading academics, area experts, and policy practitioners. The DeepDives series is made possible thanks to the ongoing support of Centre for Civic Engagement.
With a new prime minister arriving and an election potentially on the horizon, now is as good a time as any to assess the economic and fiscal performances of Canada’s prime ministers. Since 1867, 23 individuals have served as Canadian prime minister. Terms in office have ranged from a matter of a few weeks in the case of figures like Charles Tupper to over two decades in the case of William Lyon Mackenzie King.
Economic and fiscal outcomes aren’t the only way to judge a prime minister’s record. But they are, of course, big ones and integral parts of history’s judgement. The purpose of this DeepDive essay is to assess the economic and fiscal performances of Canada’s prime ministers.
Focusing on the outgoing prime minister, aside from absolute growth in population and immigrants, Justin Trudeau’s legacy will be one of middling to below average performance on key indicators like real GDP per capita, inflation, and fiscal management
However, after evaluating several metrics, the most well-rounded and successful prime minister was Louis St. Laurent. His performance was significantly above average in managing debt and deficits, population and immigration growth, real per capita GDP growth, and maintaining moderate yet above-average inflation.
Let’s dive into the numbers.

Measuring the success of prime ministers
There are various factors that influence the economic and fiscal records of prime ministers, including their duration in office, the quality of their overall team (including cabinet ministers and staff), and of course external events. When British Prime Minister Harold MacMillan was asked about what the biggest challenges were, he famously replied “Events, dear boy, events.”
As a small open economy, external economic and fiscal events have been frequent and generally out of the hands of any prime minister. Canada’s first two prime ministers—John A. Macdonald and Alexander Mackenzie—were both hit by the Panic of 1873 and what turned into what used to be termed the Great Depression—until the 1930s—with slow economic growth stretching into the 1890s. Sir Wilfrid Laurier fortuitously came into office at about the same time as a world upturn in commodity and wheat prices, and his years in office coincided with the great Canadian boom period of Western settlement and economic growth. Sir Robert Borden had to contend with the financial demands of the First World War that saw him bring about personal income and business taxation. And, of course, these men’s successors have faced a slew of conflicts, economic booms and busts, and pandemics just to name a few.
Although our prime ministers cannot greatly influence the course of world events, how Canada has performed in terms of both economic and fiscal indicators, which are inevitably intertwined, is a metric of how well their governments were able to respond to world events.
The following charts attempt to present a broad sweep of indicators and rankings of primarily economic and fiscal nature for prime ministerial tenures based on data taken from an assortment of sources: Finances of the Nation, the Fiscal Reference Tables, Statistics Canada, the Canada Yearbook and Historical Statistics of Canada.
While there are challenges with data compatibility over time and matching data to tenures, the analysis below represents an attempt to manage these issues as best as possible. So, caveats aside, here are the results. And, while Justin Trudeau was in office until 2025, the absence of a full year of 2025 data means his term is evaluated using 2024 as the endpoint.
The economic and fiscal records of Canada’s prime ministers
Figures 1 to 3 provide an overview of overall trends in population, real per capita GDP, and net debt to GDP at approximately the start and end of each prime minister’s term to provide some temporal context for the subsequent rankings. All prime ministers saw population increases during their terms in office, and naturally, longer terms saw a larger absolute increase. In terms of the largest absolute increases, they are Justin Trudeau (2015-2024) at 5.5 million, Louis St. Laurent (1948 to 1957) at 3.9 million, and Pierre Elliot Trudeau at 3.5 million.
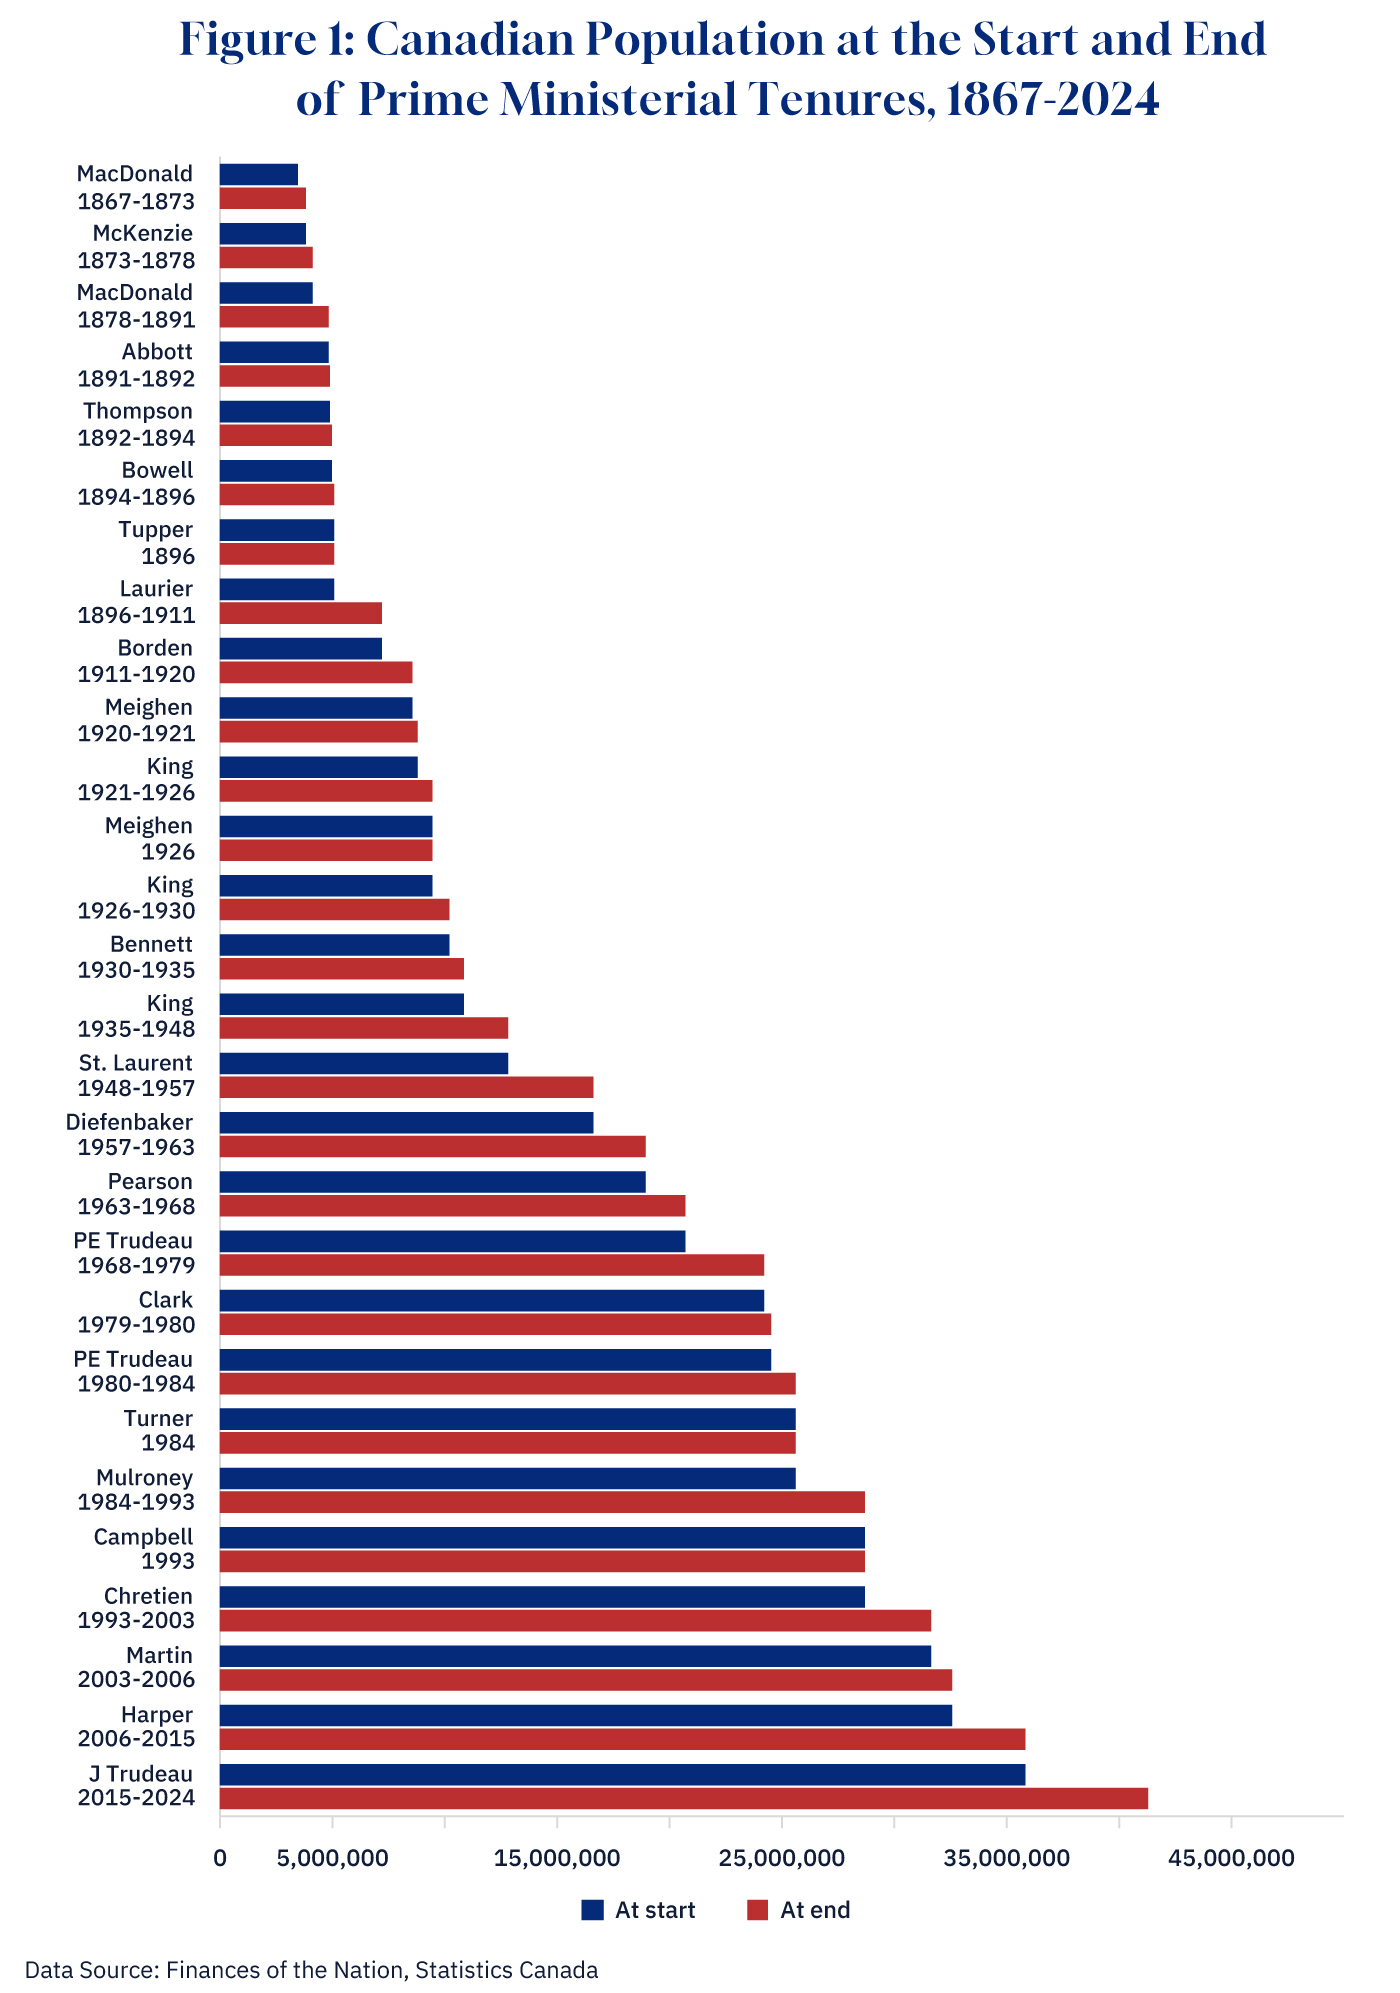
Graphic credit: Janice Nelson.
As for real per capita GDP, a common measure of average living standards, aside from those whose terms fall within one year, nearly all prime ministers saw an increase in real per capita GDP between the start and end years of their term.
But there were six exceptions: Sir Alexander McKenzie (1873-1878) with a 9 percent drop, Sir John Abbot (1891 to 1892) with a 2 percent drop, Sir Mackenzie Bowell (1894-1896) with a 4 percent drop, Sir Robert Borden (1911-1920) with a 7 percent drop, Arthur Meighen (1920-21) with an 11 percent drop (and also proof that pre-1926 you did not need to be knighted to be associated with falling real per capita GDP), R.B. Bennett (1930-35) with an 11 percent drop, and finally P.E. Trudeau’s second term (1980-84) which saw a one percent drop.
While the outgoing incumbent of the office has been associated with falling real per capita GDP over the past two years, overall, Justin Trudeau still saw an increase between 2015 and 2024.

Graphic credit: Janice Nelson.
In terms of the net debt-to-GDP ratio, Figure 3 illustrates that it has seen its ups and downs, with some prime ministers exiting with a lower net debt-to-GDP ratio and others with a higher one. Those showing a decrease in the net debt-to-GDP ratio are Macdonald, Abbott, Laurier, King (1926-30), St. Laurent, Diefenbaker, Pearson, P.E. Trudeau (1968-79), Chretien, Martin, and Harper. The largest percentage point reduction from start to finish (– 50 points) was Louis St. Laurent followed by Laurier (-24 points), and then Chretien (-21 points). As for the largest increases: Mulroney (28 points), with Meighen (1920-21) and R.B. Bennett tied for the next place (at 24 points), and then King (1935-48) at 21 percentage points.
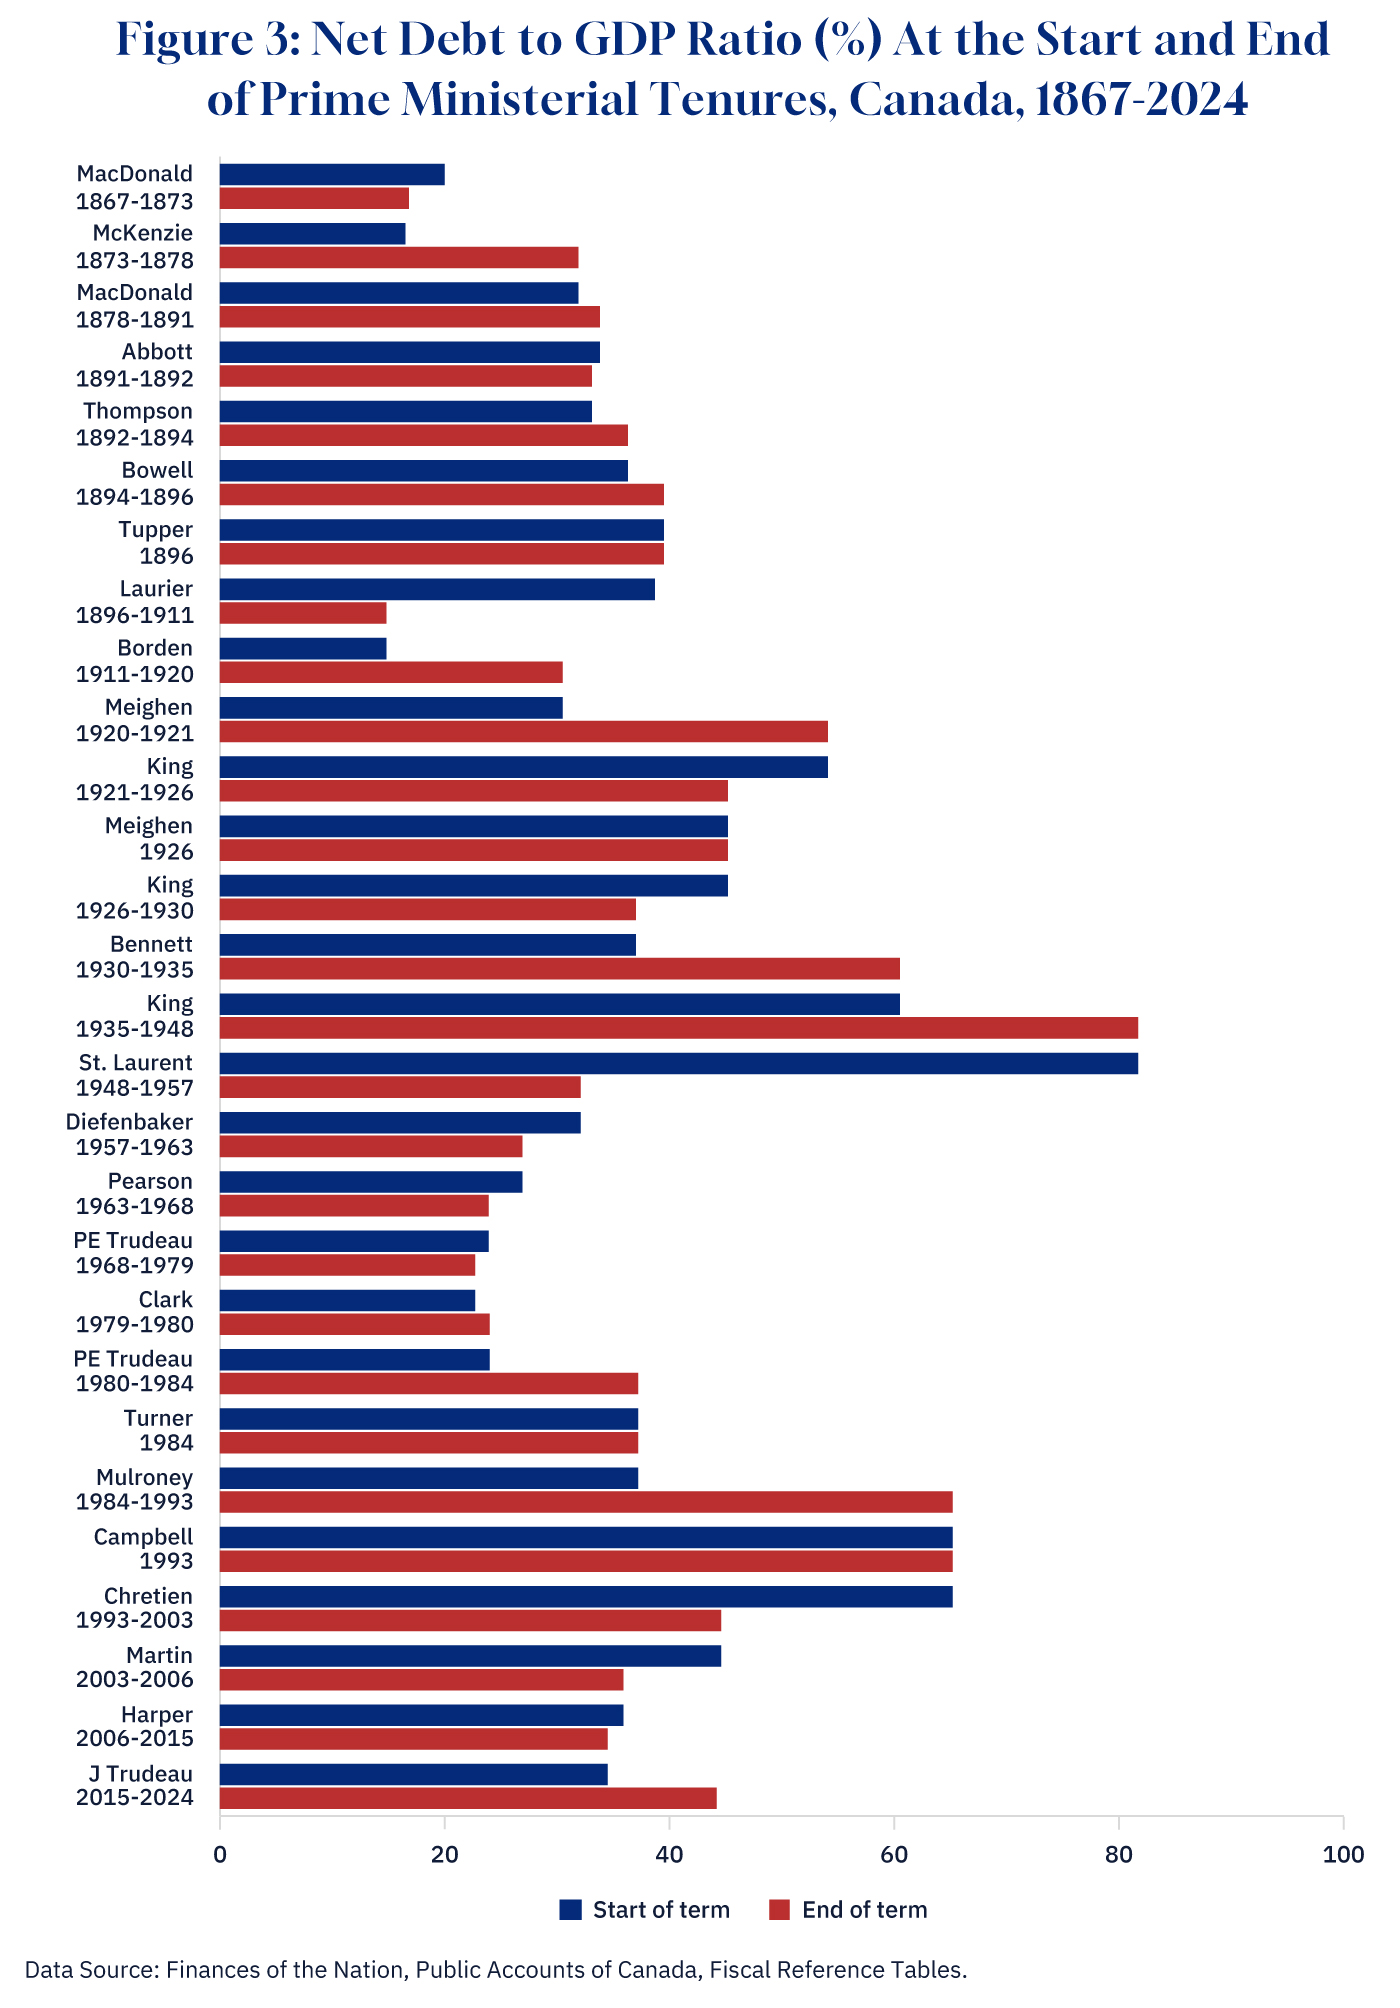
Graphic credit: Janice Nelson.
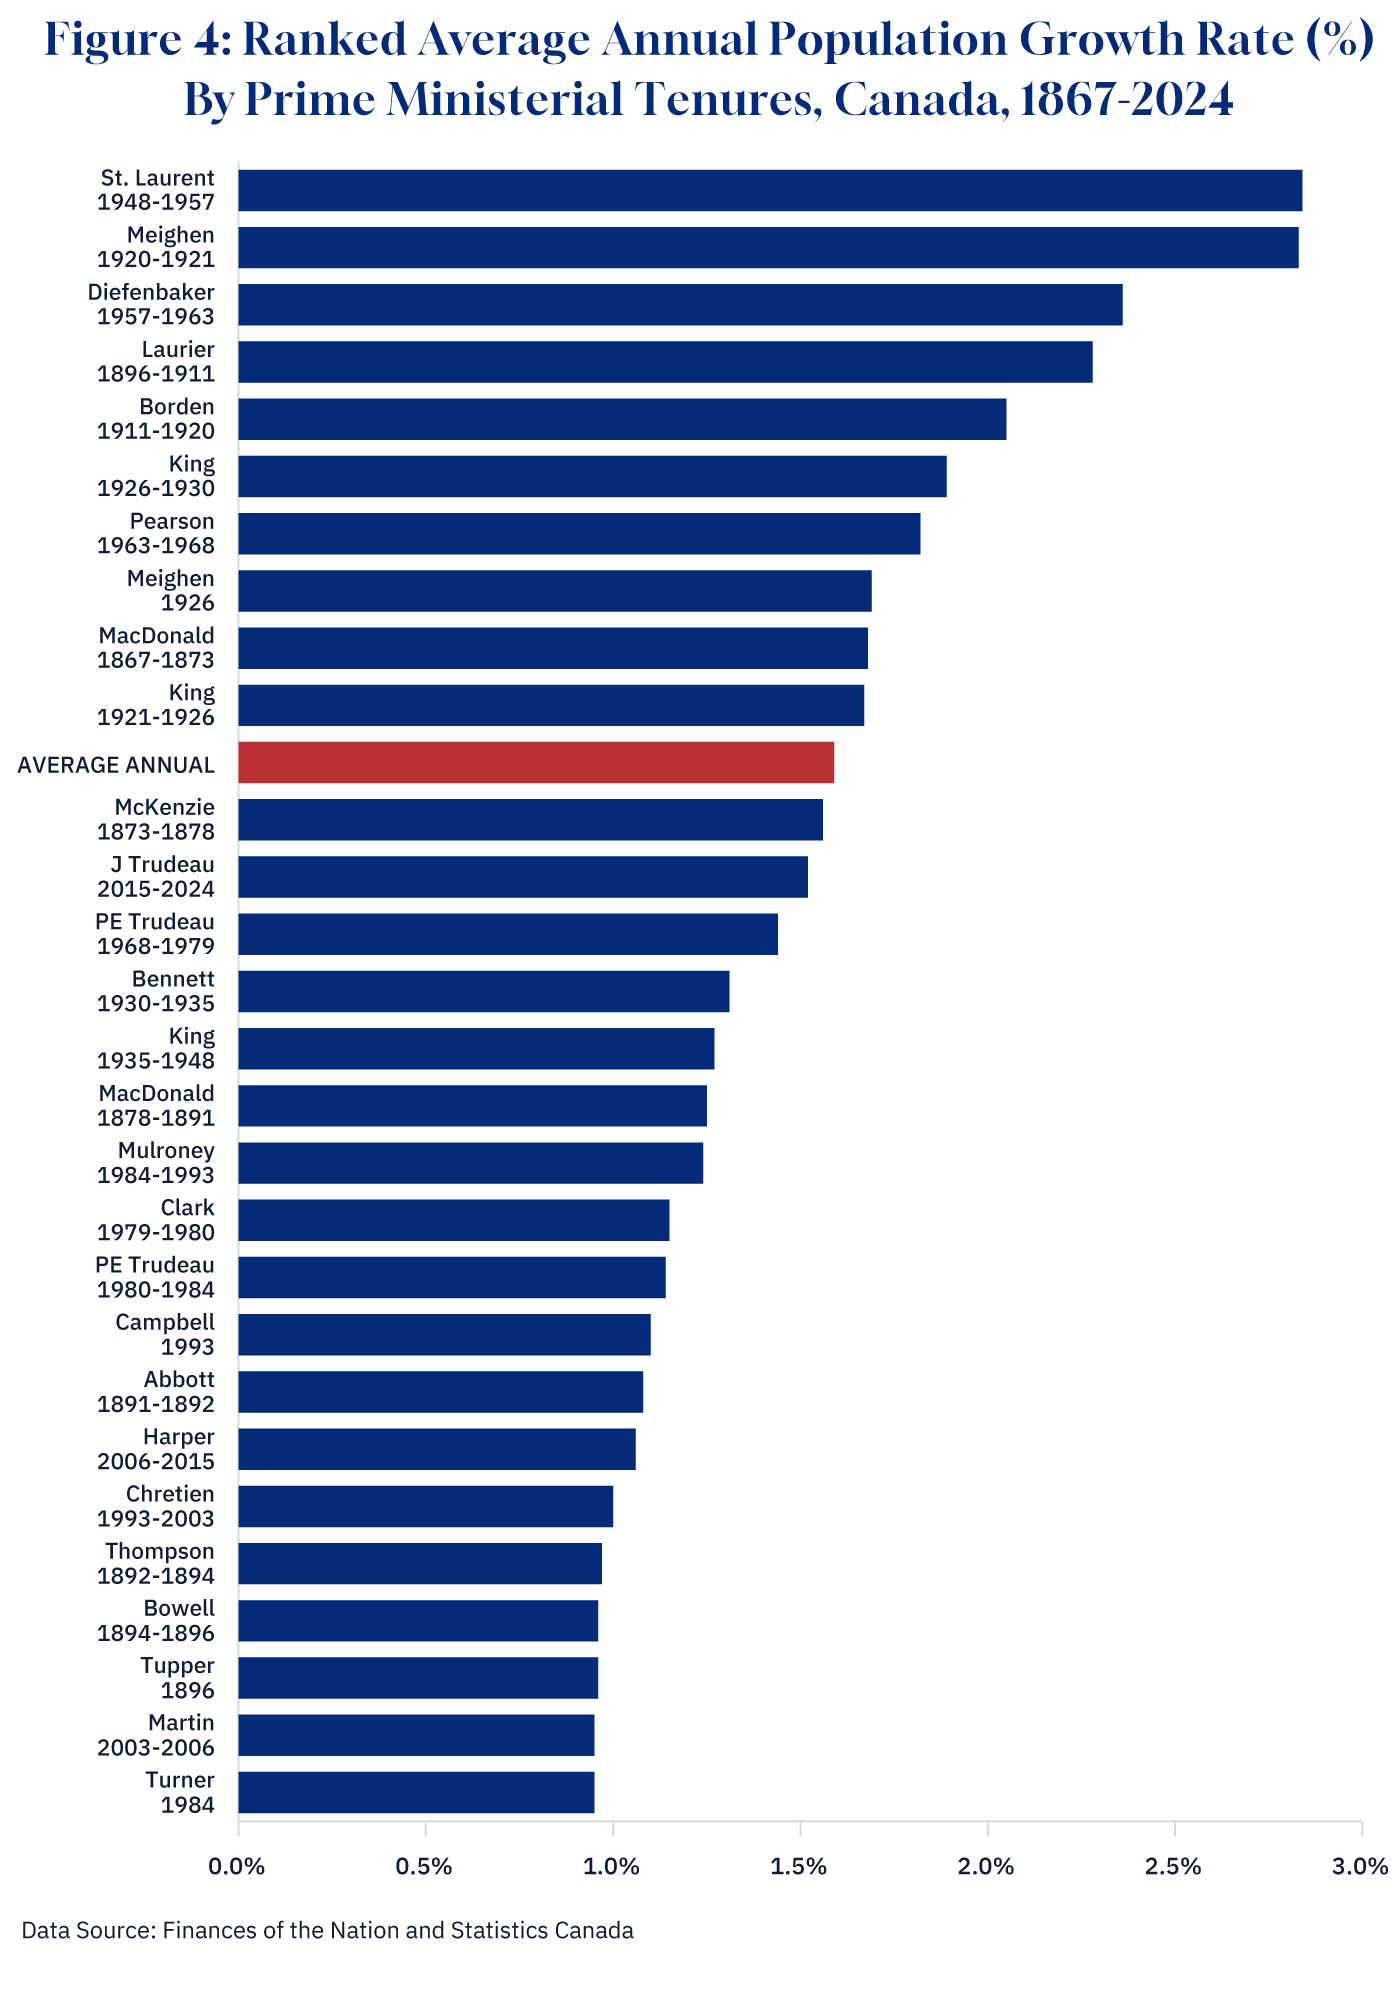
However, any ranking needs to adjust for the length of term to create a more level playing field, so to speak, and that can be done by looking at average annual numbers. This is done in Figures 4 to 9 for an assortment of indicator variables. Considering recent concerns about rapid population growth in Canada and its impact on housing and health care, Figure 4 puts population growth into historical perspective by plotting the ranked average annual population growth for each prime minister along with the average annual growth rate from 1867 to 2024 at 1.6 percent.
St. Laurent, Meighen, Diefenbaker, Laurier, and Borden saw the fastest rates of population growth, with all of them above 2 percent—well above average. At the bottom, at close to 1 percent annually, are Thompson, Bowell, Tupper, Martin, and Turner.
The most recent prime minister’s performance here at 1.5 percent annual growth is quite close to the average but comes after below-average annual growth for his immediate predecessors—Chretien, Martin, and Harper, who were all at about 1 percent.
Graphic credit: Janice Nelson.
Economic performance is a key metric, and there has been a lot of angst about our declining real per capita GDP growth as well as its decline relative to the United States. Figure 5 ranks prime ministers by the average annual growth rate of real per capita GDP, keeping in mind that for some prime ministers, the number is just a point estimate given their short tenure. From 1867 to 2024, real per capita GDP’s average annual growth rate is 2.1 percent. At the top of the chart is Mackenzie King, whose tenure included the end of the Great Depression, the Second World War, and the start of the post-war boom, which saw an annual average real per capita GDP growth of 5 percent.
Next are Pearson and then Turner, both at over 4 percent, followed by Laurier at 4 percent, and then P.E. Trudeau at about 3.5 percent. The worst performance—at minus 7 percent—occurred during Meighen’s first tenure, which was during the steep downturn in the aftermath of both the First World War and the Spanish Flu. Other notable negative performances happened under the watches of Tupper, Bennett, and Alexander Mackenzie. In general, prime ministers who served during significant global economic shocks or downturns are associated with below-average performances. Timing is everything, as Mackenzie King’s first term (1926-30) is below average while his second term (1935-48) tops the chart. Similarly for P.E. Trudeau, whose first term was above average (1968-79) and then well below average the next time around (1980-84).

Graphic credit: Janice Nelson.
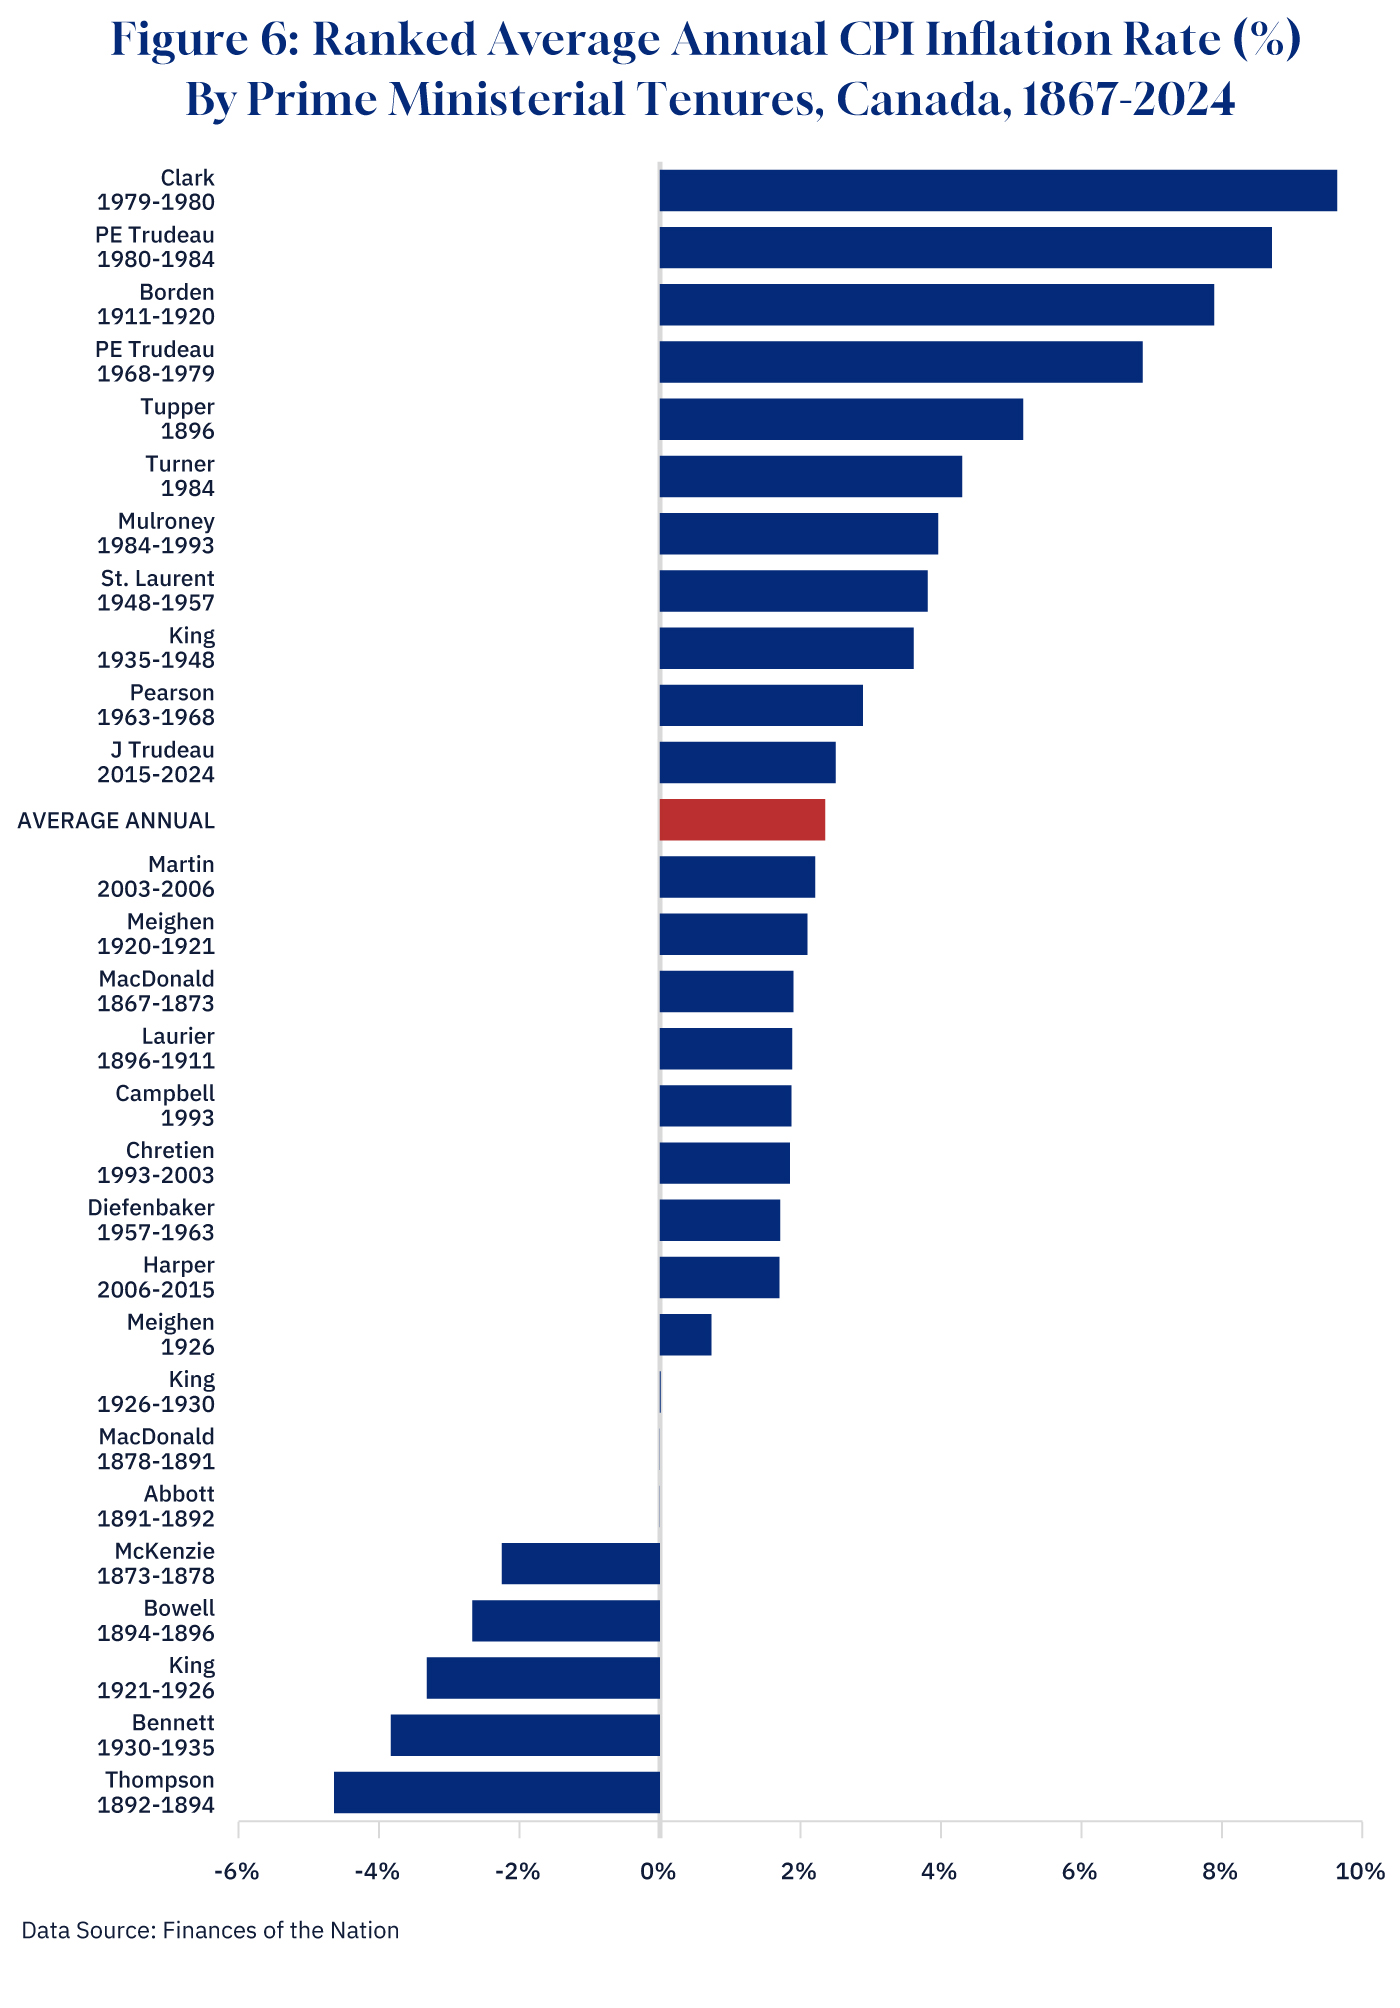
If cost of living is your preferred metric, then average annual CPI inflation (Figure 6) yields some interesting insights. The overall average rate of CPI inflation from 1867 to 2024 was 2.4 percent. The highest inflation rates were during the 1970s and early 1980s, with the average annual inflation rate above 6 percent for Clark, both tenures of P.E. Trudeau, and Borden. The experience of the two World Wars can be contrasted with that of the First World under Borden, which saw an average of nearly 8 percent annual inflation, while the era spanning the Second World War under Mackenzie King was less than half that rate. One can chalk up that differential performance to either the acquisition of economic experience in managing wartime inflation or perhaps more directly the wages and price controls and economic management in effect during the Second World War. Canada has also seen some periods of deflation and again all of these seem to coincide with tenures near significant economic downturns—Thompson during the recession of the early 1890s, Bennett during the Great Depression, Mackenzie King in the aftermath of the early 1920s downturn, Bowell during the long recovery after the recession of the early 1890s, and Alexandar Mackenzie during the depression of the 1870s.
Graphic credit: Janice Nelson.
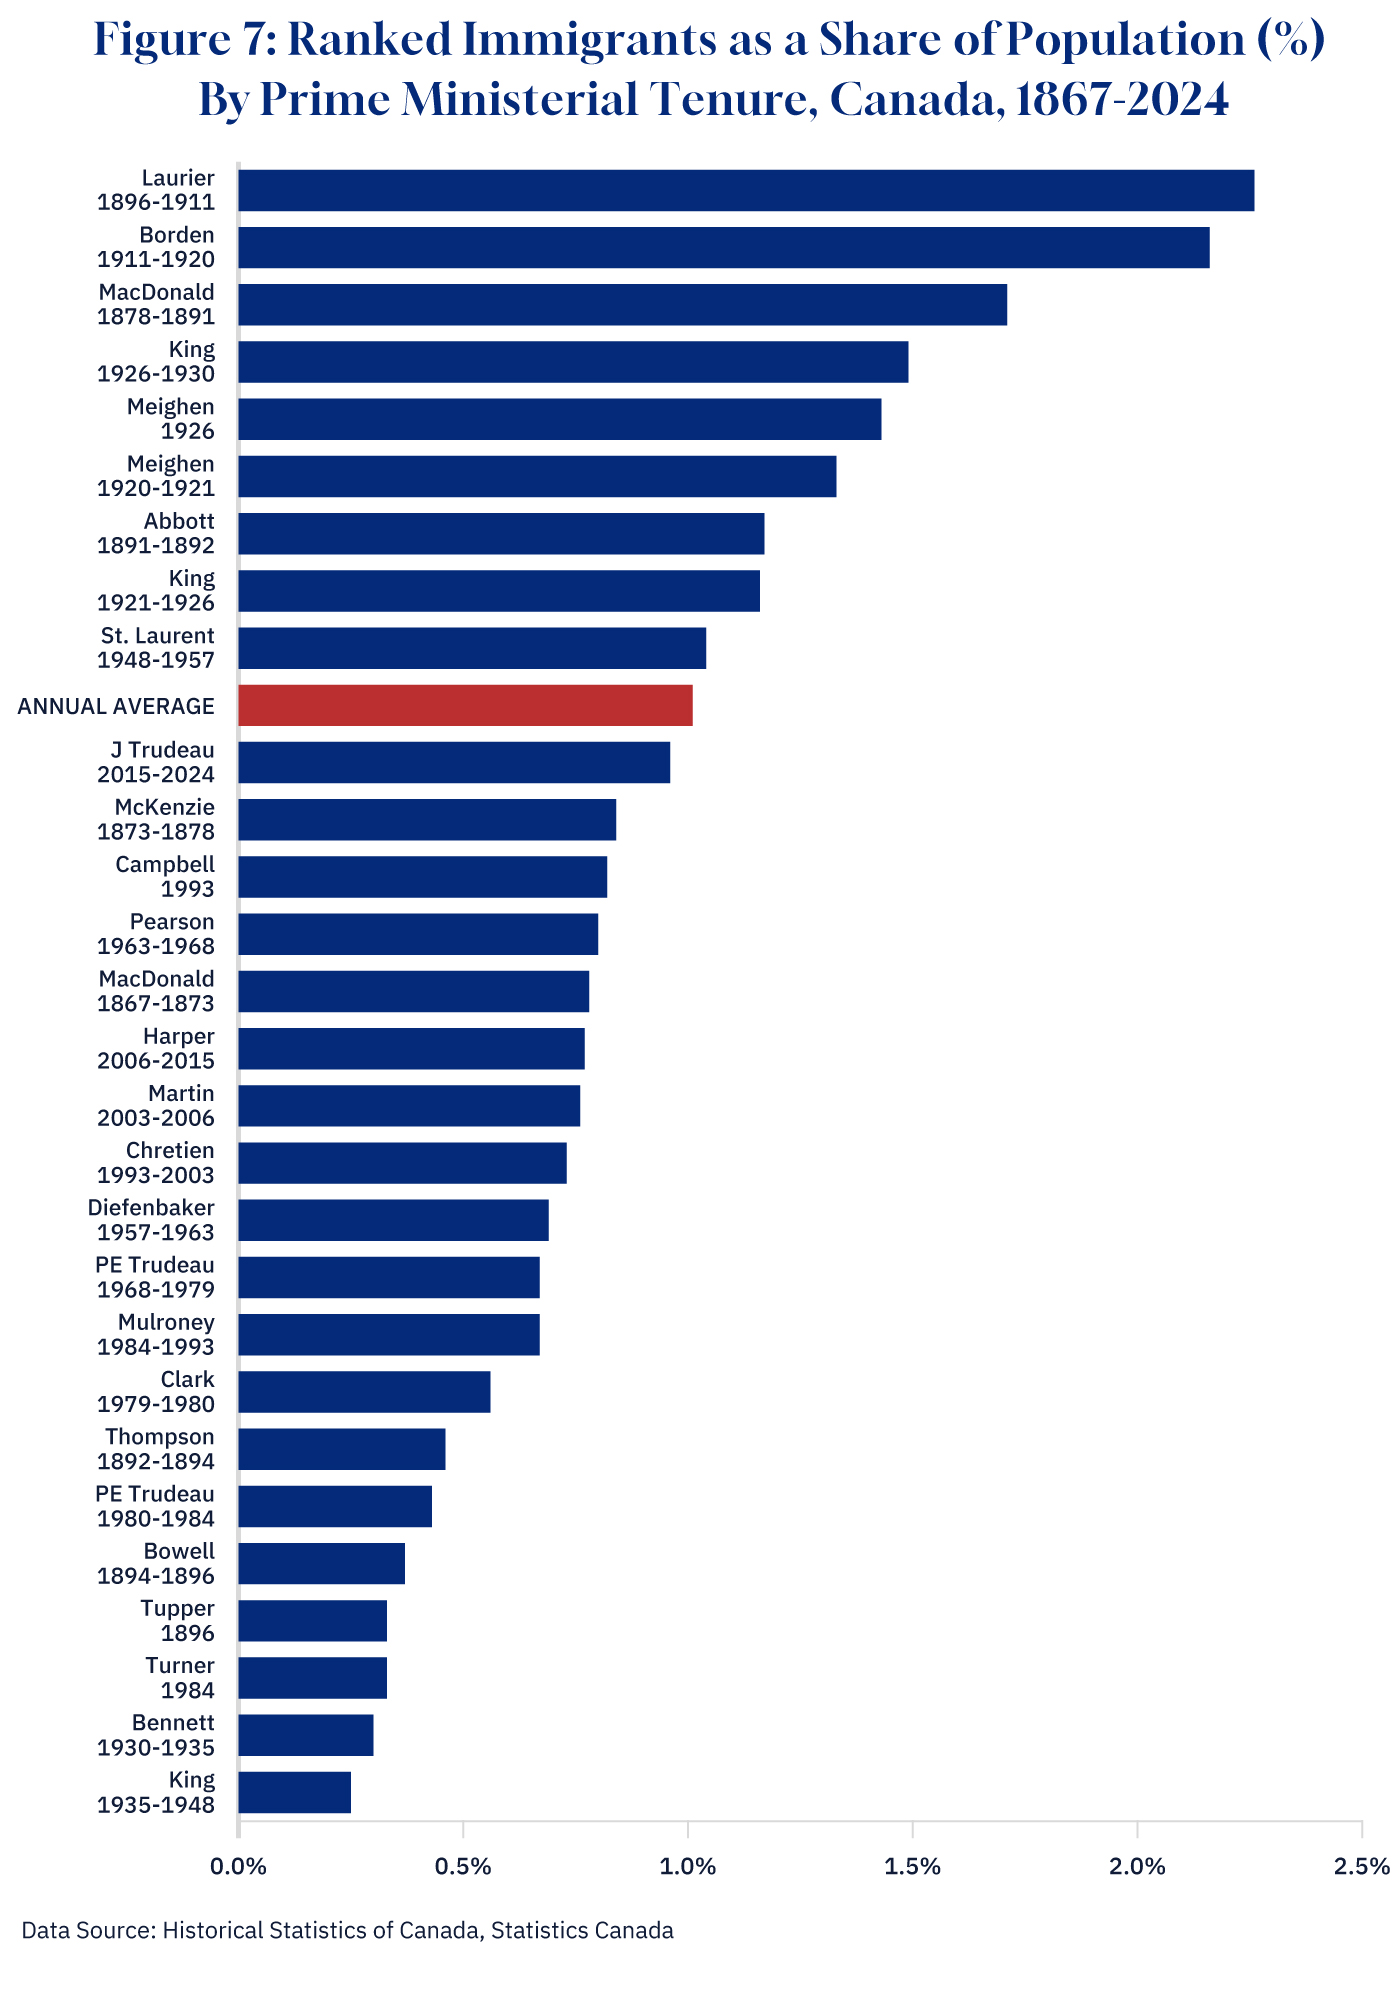
Immigration and population growth have been up-front and centre as issues over the last two years, and Figure 7 ranks immigration as a share of the population. While recent years have seen the largest absolute flow of immigrants to Canada in absolute numbers, as a share of population, the largest flows are in the past. Laurier and Borden saw the highest annual average shares of immigrants to population at over 2 percent. While Justin Trudeau tops the chart in absolute numbers, as a relative share of the population, he comes in at the bottom of the top third and just below the overall average of 1 percent, although these immigrant numbers don’t include temporary migrants.
Graphic credit: Janice Nelson.
The public finances are another area where prime ministers face challenges, and our prime ministers have been challenged indeed. Over the period 1867 to 2024, Canada’s federal government has run a deficit approximately 75 percent of the time. The longest consecutive periods of surplus or balanced budgets were during the “Roaring Twenties” from 1924 to 1930, the post-Second World War period from 1947 to 1952, and the aftermath of the federal fiscal crisis from 1998 to 2008. The longest period of consecutive deficits was the runup to the federal fiscal crisis of the 1990s, with deficits consecutively from 1971 to 1997.
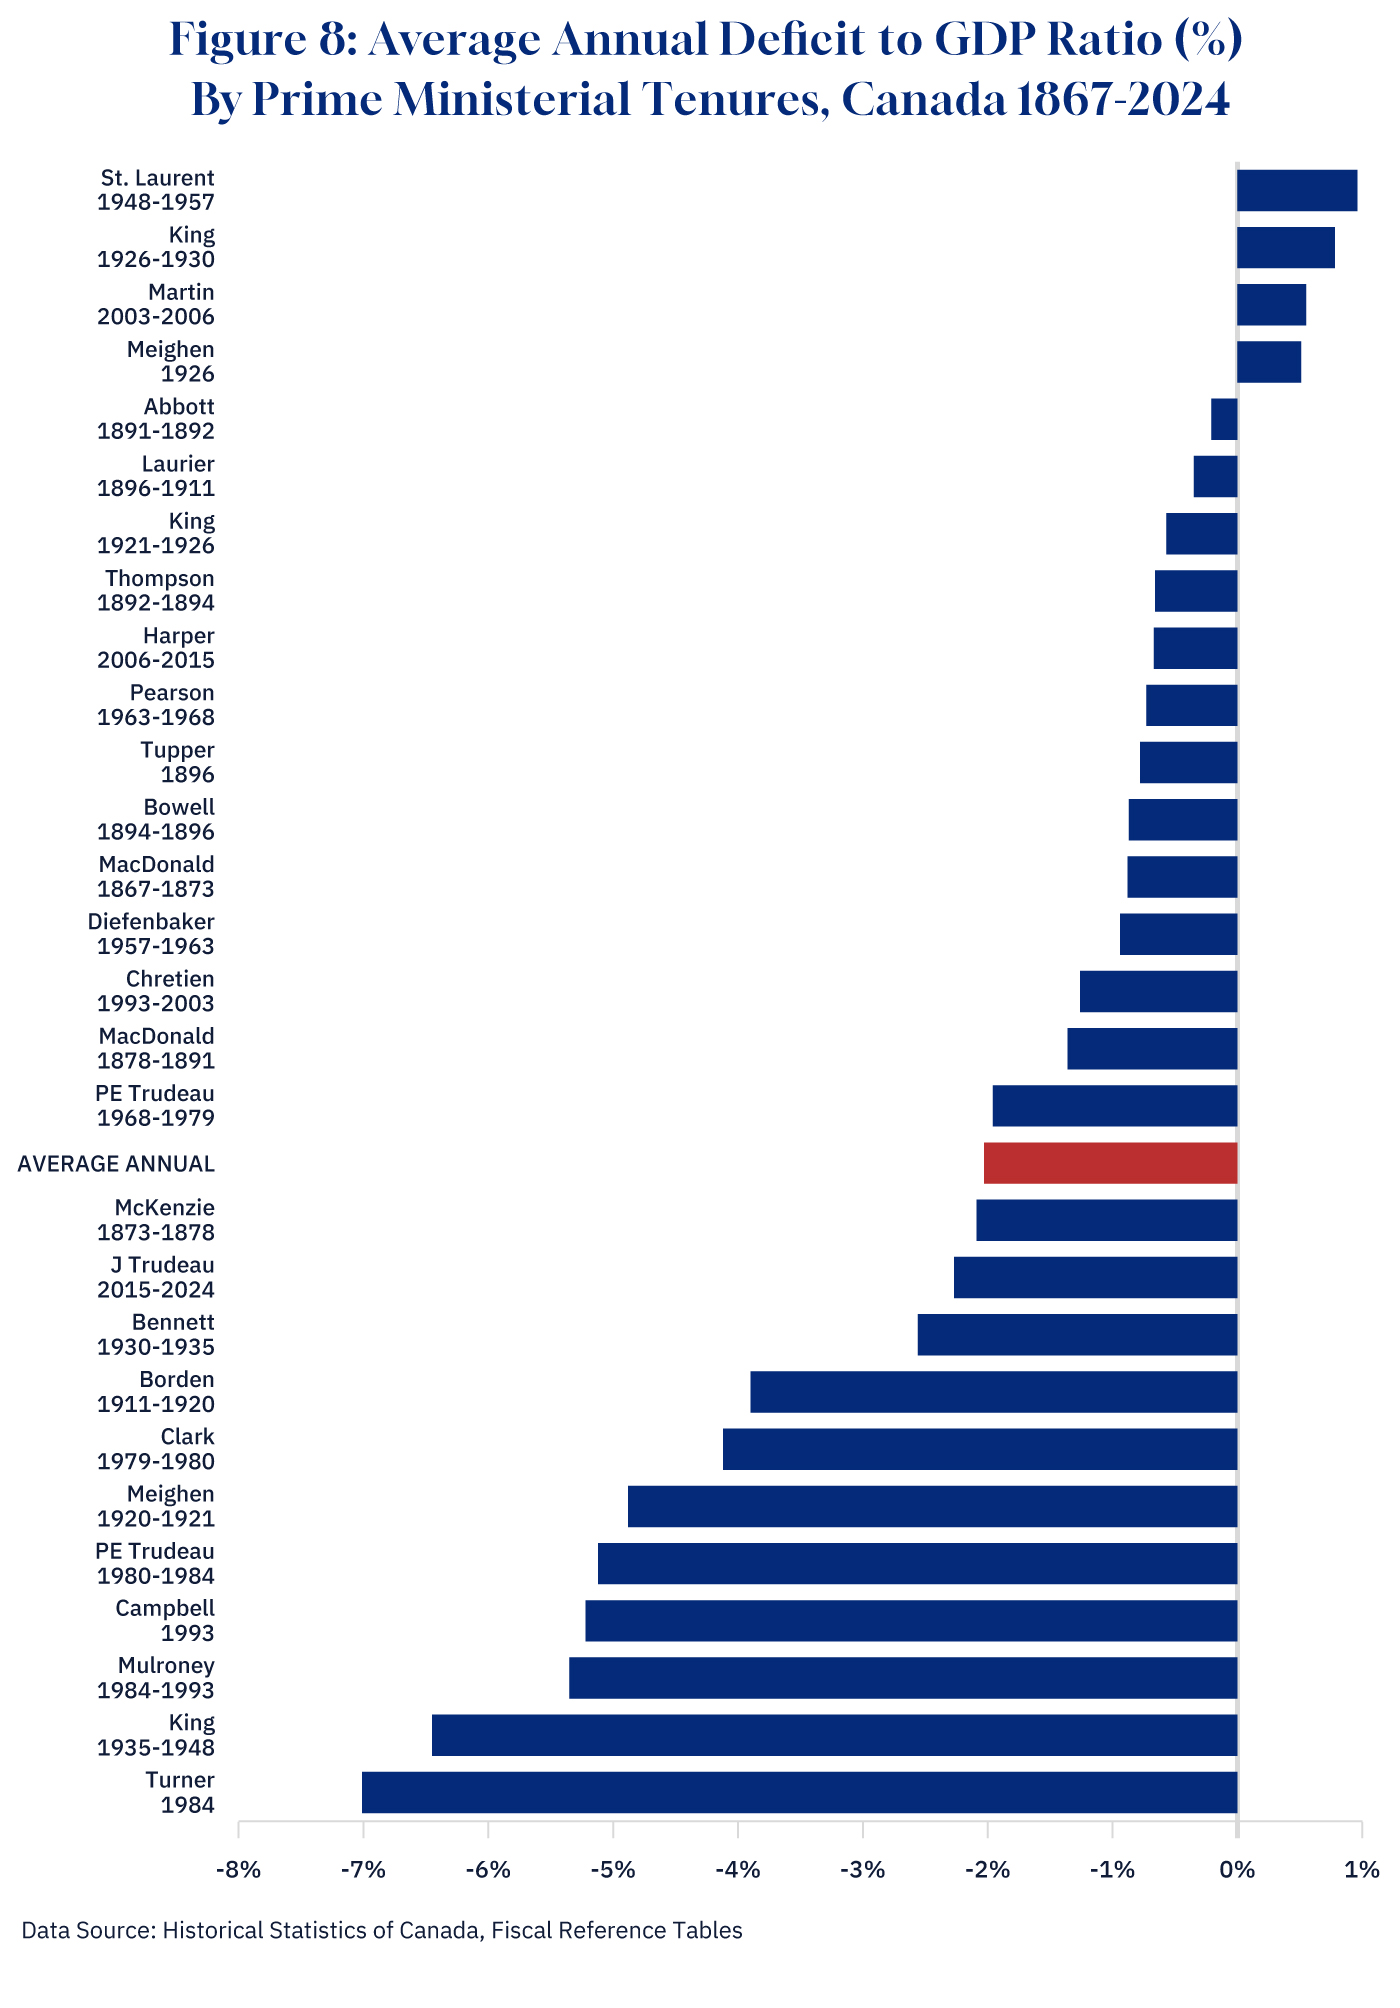
However, rather than count deficits, another metric to measure the severity of deficits is the deficit-to-GDP ratio, which, for the 1867 to 2024 period, averaged 2 percent. Figure 8 ranks the prime ministers by the size of the deficit-to-GDP ratio, and only a select few can claim the mantle of average surpluses during their tenure. St. Laurent was the clear winner here, with an average surplus-to-GDP ratio of nearly 1 percent. He was followed by King (1926-30), Martin, and Meighen (1926). After that, deficit-to-GDP ratios are progressively larger, with the largest being under Campbell, Mulroney, King (1935-48) and Turner. Of course, Campbell and Turner have the misfortune of being one-year entries, Mulroney’s term combined recessions and high interest rates while King had a world war to fight.
Graphic credit: Janice Nelson.
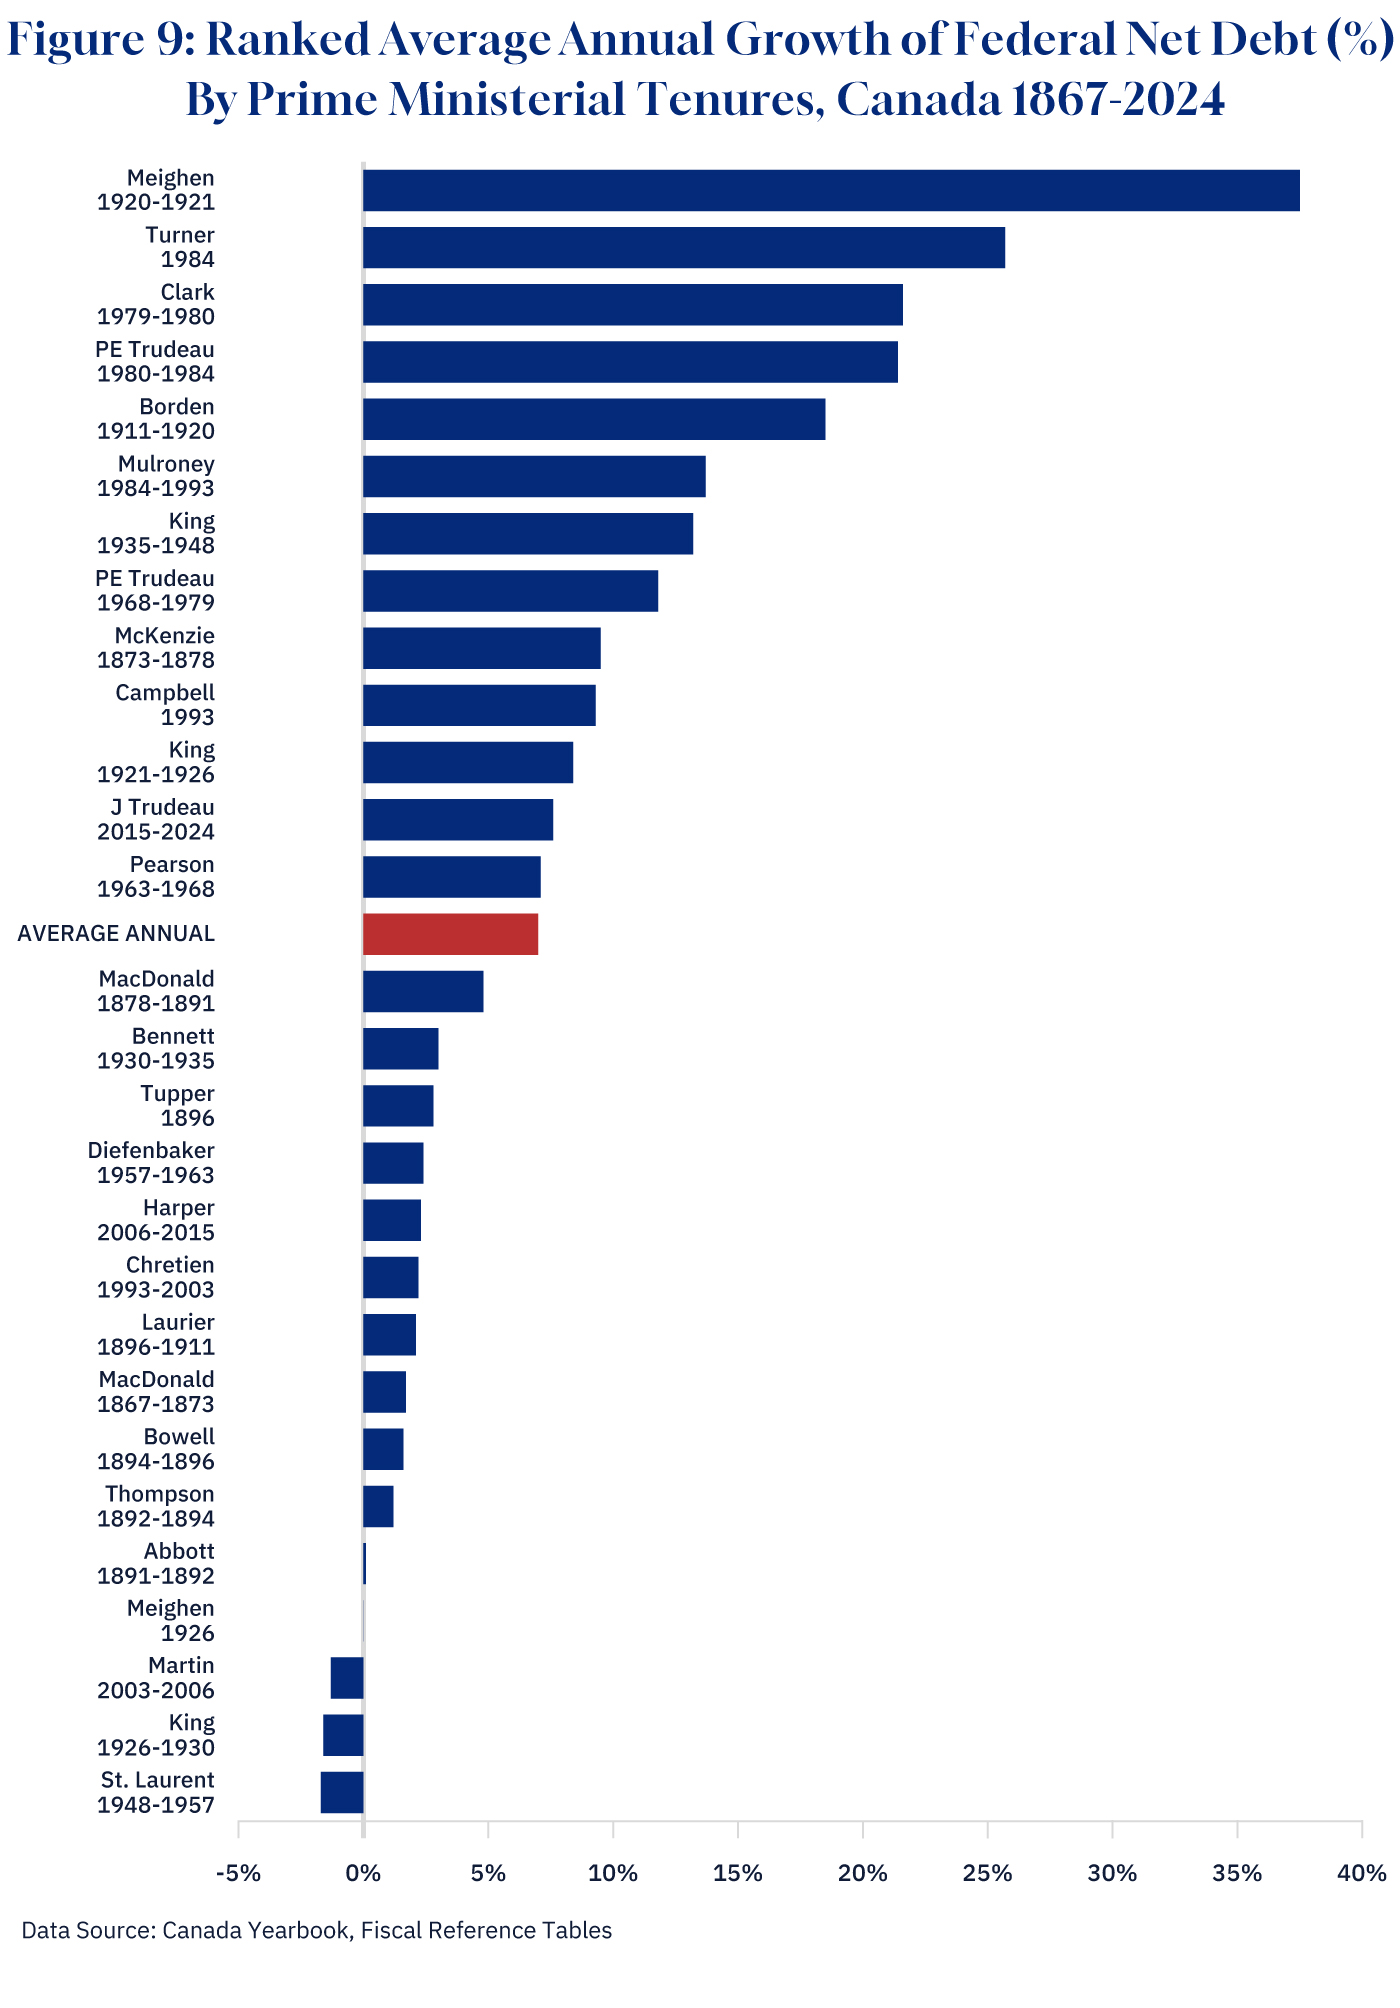
Economic and political circumstances have a way of foiling the best intentions when it comes to fiscal rectitude, and this is further reinforced if one looks at the average growth rate of federal net debt by prime minister plotted in Figure 9. The first interesting statistic is that on average, the federal net debt has grown since Confederation at an annual rate of 7 percent. The largest average percentage increases in net debt were under Meighen (1920-21), Turner (1984), Clark (1979-80), P.E. Trudeau (1980-84), and Borden (1911-20), followed by Mulroney and King (1935-48). These large increases were associated with the World Wars—Borden and King—and the stagflation and high-interest rate environment of the post-1973 Oil Crisis—P.E. Trudeau, Clark, Turner, and Mulroney. On the other hand, on average, the growth of the federal net debt appears to have been in definite remission during the tenures of Martin, King (1926-30), and St. Laurent.
Graphic credit: Janice Nelson.
Who was the most successful prime minister?
As a new prime minister arrives, what are the lessons from all these charts and indicators? The most important thing to remember is that Canada is a small open economy. While Canadian prime ministers have made some notable contributions on the international stage (Pearson and Mulroney both come to mind here), they generally cannot control the course of world political and economic affairs or the arrival of war, plague, and pestilence for that matter.
Moreover, a prime minister operates within a federal system with responsibilities that are often shared with the provinces, and which have evolved over the course of Confederation because of changes in convention or the result of legal rulings. For example, while disallowance is a federal power under the Constitution (disallowance is a federal power that allows it to declare provincial laws null and void), the last time it was used was 1943, and legal rulings over time have often interpreted the Constitution in favour of provincial rights. Then, there is the matter of minority and majority governments affecting the ability to get things done.
Yet, over the decades, there has been increasing centralization of power within the ranks of the Prime Minister’s Office. How a prime minister responds to fiscal and economic turbulence and turmoil is within their purview, and they must play the hand that they are dealt. Some have done better than others, in part because of their abilities and in part because of circumstances. For example, Laurier presided over an economic boom and Western settlement that was driven by international demand for agricultural products, but he did also put in place policies that fostered immigration and agricultural development. While Bennett faced a catastrophic depression as well as a prairie drought, his responses were seen as ineffective and incoherent. And yet, his accomplishments included the establishment of both the CBC and the Bank of Canada.
All the prime ministers have faced events to test their problem-solving skills. Is there a clear winner? MacDonald, as the first prime minister, is in many respects in a league of his own as the only prime minister to take office at the start of a vast national experiment that erected an east-west economic and political structure against the north-south grain of the North American continent. Subsequent prime ministers have had to build on this framework.

The statue of Canada’s 12th Prime Minister Louis St. Laurent sits of the lawn of The Supreme Court of Canada in Ottawa on Tuesday Sept. 6, 2022. Sean Kilpatrick/The Canadian Press.
However, nostalgia aside, if one had to pick the all-around most successful prime minister, it is hard not to focus on St. Laurent. St. Laurent falls well above the average on debt and deficit performance, above average on population and immigration growth, above average on real per capita GDP growth, and with moderate inflation.
St. Laurent was perhaps the most fortunate of Canadian prime ministers, serving during the natural resource, baby, and immigration boom of the 1950s when economic growth seemed the natural order of things. At the same time, he still faced problems such as moderately high inflation. His era was one of high population growth and disruption as newcomers crowded into cities, and yet his era came with a high rate of per capita GDP growth and improved public finances.
Indeed, St. Laurent’s tenure seems associated with a bygone golden age when governments actually seemed to be able to get things done if one witnessed legacies such as the Trans-Canada highway, the Trans-Canada Gas Pipeline, and the St. Lawrence Seaway Project. This era also saw the onset of federal initiatives in health and income transfer payments, including the Hospital Insurance and Diagnostics Act, the onset of Equalization, and the current Old Age Security system.
He also had strong cabinet members like C.D. Howe, who were also adept at getting things done. While one might wonder how St. Laurent would have handled a Great Depression or world war, the fact remains that even St. Laurent’s tenure saw challenges such as the Korean War, as well as recession and slower growth in the late 1950s. St. Laurent was not just lucky. Having all the economic and political ducks lined up in heavenly alignment cannot save a prime minister without the ability to recognize and then seize opportunities.
So, good luck to the 24th prime minister, and may the odds be ever in your favour. Once again, the drama begins.

Livio Di Matteo is Professor of Economics at Lakehead University and a member of the CIHI NHEX Advisory Panel. The views expressed…