DeepDives is a bi-weekly essay series exploring key issues related to the economy. The goal is to provide Hub readers with original analysis of the economic trends and ideas that are shaping this high-stakes moment for Canadian productivity, prosperity, and economic well-being. It features the writing of leading academics, area experts, and policy practitioners. The DeepDives series is made possible thanks to the ongoing support of the Centre for Civic Engagement.
Violent crime has re-emerged as a defining political issue in Canada. Poll after poll shows that Canadians feel less safe in their communities and that crime is a growing concern. After years of rising violence, the federal government has introduced legislation designed to toughen sentencing and protect victims.
At the same time, a counter-narrative has developed. The John Howard Society has written that “Crime is down in Canada … but you’d never know it” and that “a lot of what is classified as ‘violent crime’ does not involve what most of us would think of as significant violence.” A recent Globe and Mail article cited “false perceptions about crime,” and polling about rising public concern was accompanied by headlines that Canadians “feel unsafe despite crime rates dropping” and “feel more unsafe, despite data saying otherwise.” One criminologist quoted by CTV News surmised that “Most people aren’t checking out Statistics Canada to find out what’s actually happening.”
This DeepDive checks Statistics Canada to find out what’s actually happening. To do so, it explores an oft-ignored metric: the violent crime severity index, which accounts for both the amount and relative seriousness of crime.
The analysis shows the naysayers are wrong: Violent crime severity increased considerably in every province and nearly every major city over the last decade. In most provinces, the past few years have produced the highest levels of violent crime severity recorded at any point since the index began in 1998.
The public may be anxious about violent crime, but they are not mistaken.

What is the violent crime severity index?
Crime rates tend to grab the most media attention. Individual police services keep their own detailed crime data, which are then compiled by Statistics Canada, aggregated, and published as annual “incident-based crime statistics.” The result—a comprehensive data source of crime rates across the country, accompanied by a short summary—is usually published in July or August each year, accompanied by a flurry of media headlines about whether crime is increasing or decreasing.
These crime rates reflect police-reported criminal “incidents” per 100,000 people, which refer to an “occurrence of one (or more) criminal offence(s) during one single, distinct event.” Violent crimes are typically categorized according to the “most serious violation” in a given criminal incident. Although there are drawbacks to using police-reported crime data—for example, they do not capture different local policing practices, nor the fact that residents may not bother to report minor crimes to police—they remain the most commonly used data source for determining trends in crime.
However, looking at the overall “crime rate” or “violent crime rate” can flatten important differences; within such categories, a minor assault and a homicide are each counted as a single violent criminal incident.
To rectify this, in the late 2000s, Statistics Canada created its crime severity index. The index applies a different “weight” to each criminal offence by multiplying its average prison sentence length by the incarceration rate—in the original crime severity index, one murder was given 306 times as much weight as a level 1 assault—and then dividing weighted offences by population.
Weights are updated based on the five most recent years of sentencing data. Although developed in 2009, the index was calculated retroactively back to 1998. The year 2006 was set as the benchmark and assigned a value of 100, with increases or decreases in crime severity measured against that year.
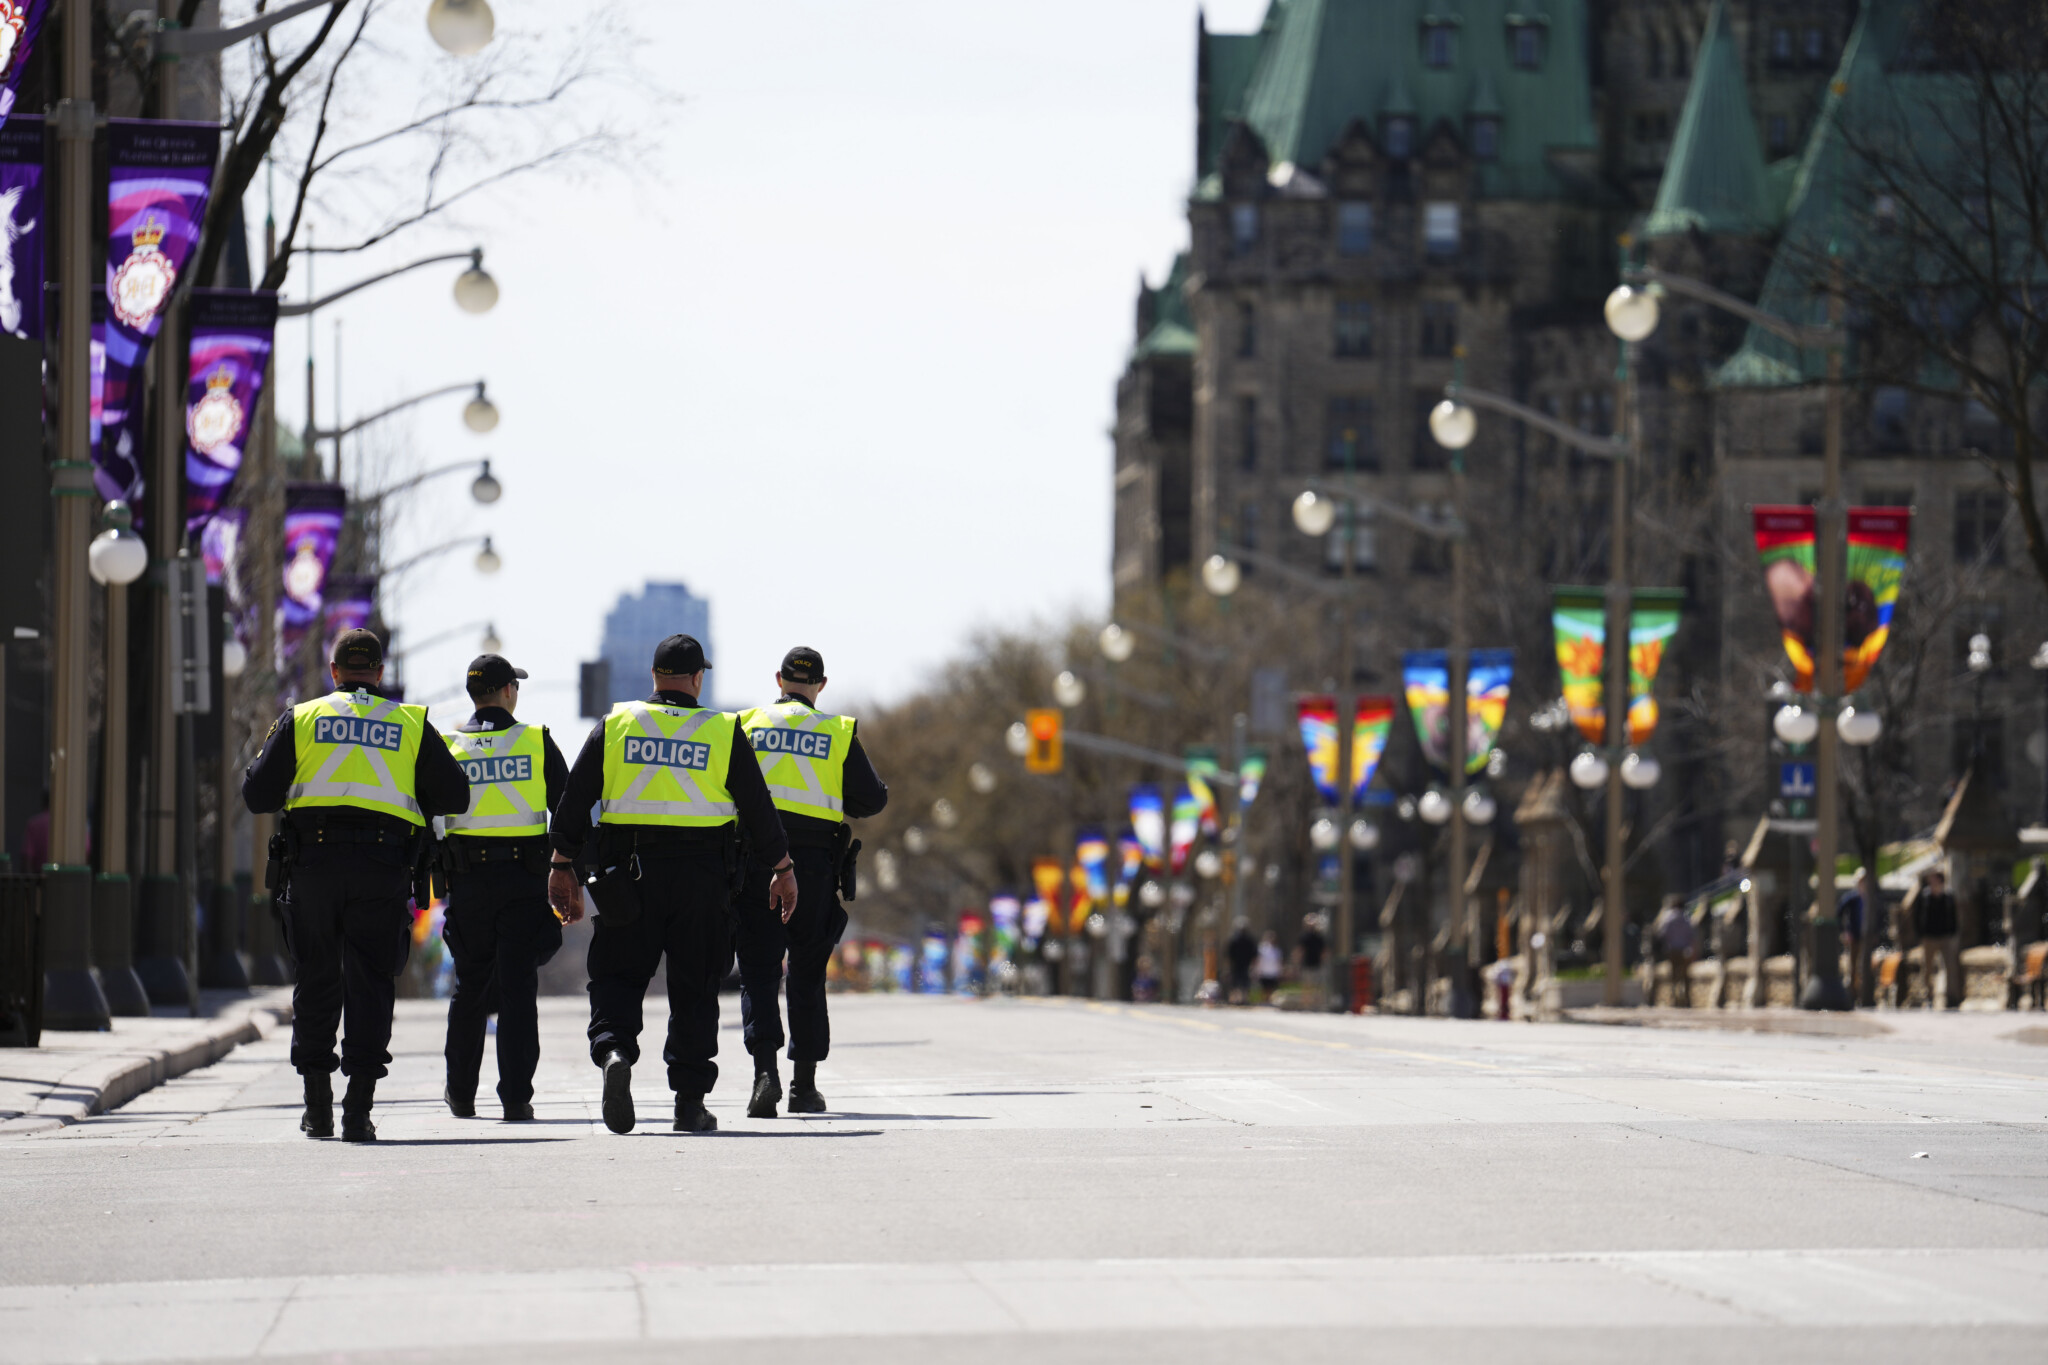
Police officers patrol downtown Ottawa on Sunday, May 1, 2022. Sean Kilpatrick/The Canadian Press.
Violent crime severity is increasing
Statistics Canada also created two sub-indices: violent and non-violent crime severity. The violent crime severity index only includes offences such as homicide, robbery, and sexual assault that involve the “use or threatened use of violence against a person,” whereas the non-violent index includes offences such as property crime, drug possession/trafficking, and fraud.
The data below focus primarily on the violent crime severity index. To prevent annual fluctuations from skewing the data, all charts use three-year rolling averages (the value for “2000” is the average of the values of 1998, 1999, and 2000; the value for “2024” is the average of the values for 2022, 2023, and 2024).
The first chart below shows changes in all three crime severity indices—total, violent, and non-violent—between 2000 and 2024. It shows that overall crime severity has decreased since 2000, but this has been driven by a sustained decline in non-violent crime severity. By contrast, violent crime severity in 2024 has surpassed its mid-2000s peak.
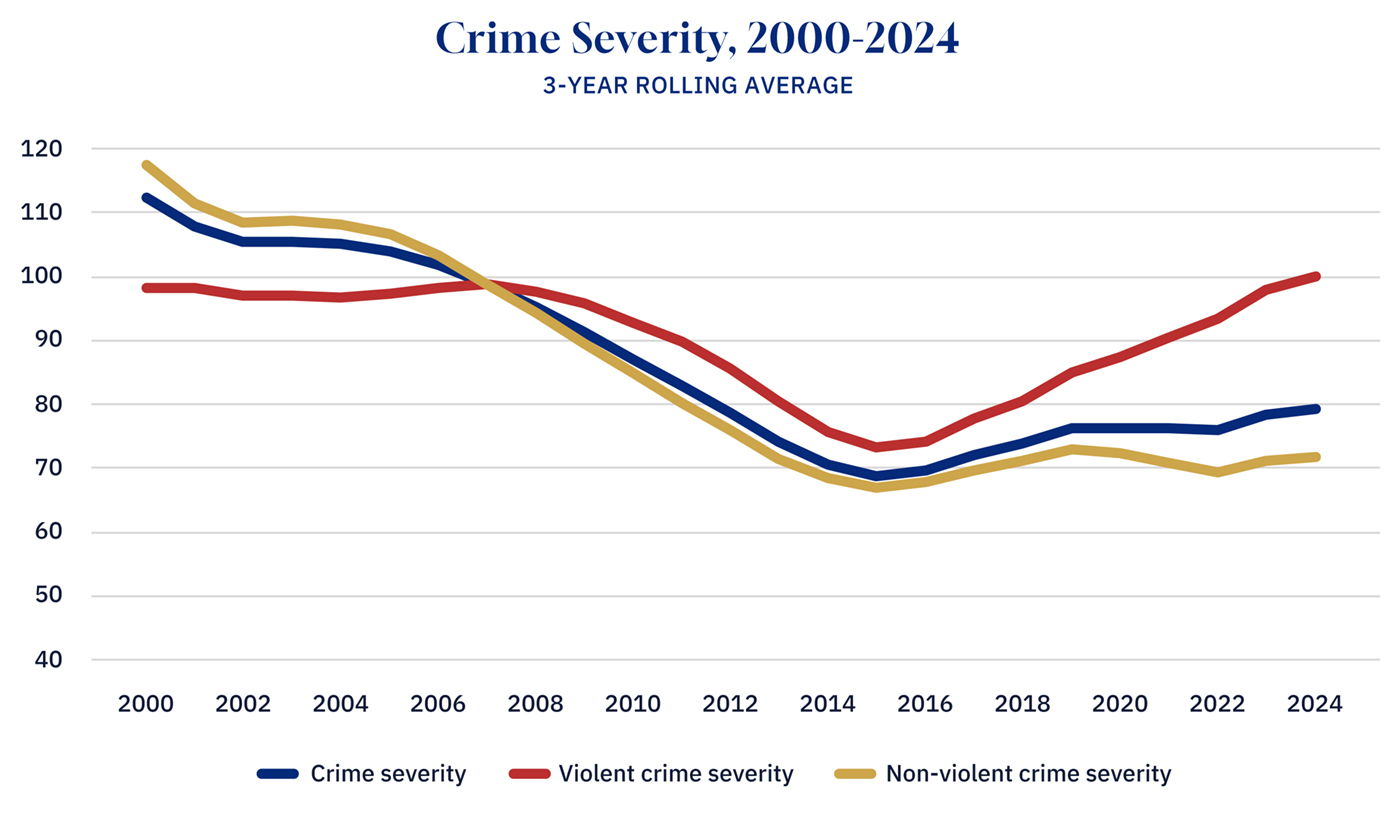
Graphic Credit: Janice Nelson.
The second chart maps the violent crime severity index alongside the violent crime rate. These two measures have developed similarly over this century: relatively flat in the early 2000s; a considerable drop from the mid-2000s until the mid-2010s; and a steady increase from the mid 2010s until 2024.
The early part of the chart shows us that violent crime rates and violent crime severity don’t always develop in parallel—that is, severity can increase while the overall rate can decrease (or vice versa). However, the two measures have tracked nearly identically over the last 20 years, with both measures now at or near highs from the 2000s.
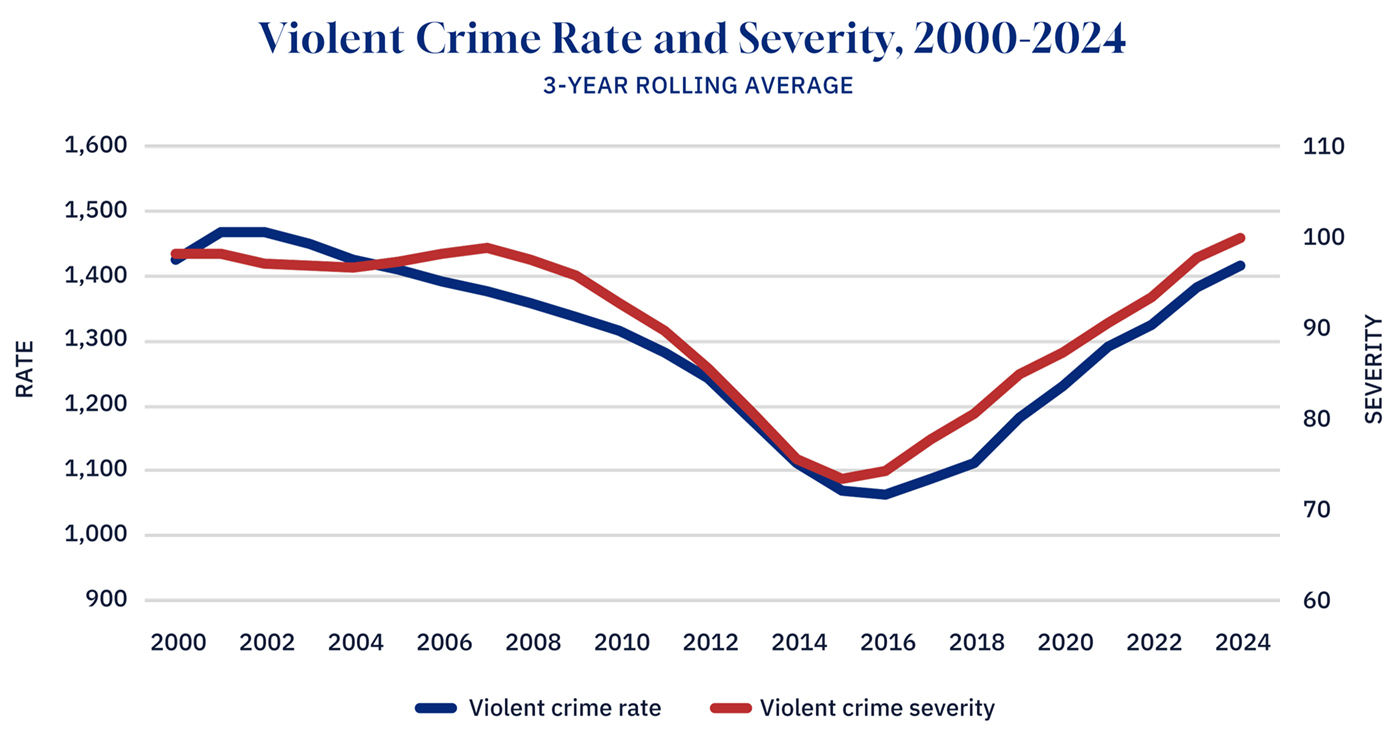
Graphic Credit: Janice Nelson.
Where is violent crime severity getting worse? Everywhere
Even though Statistics Canada data is available by region, few, if any, media analyses of crime severity move beyond a discussion of the national index. The charts below explore variations by province, territory, and census metropolitan areas (CMAs).
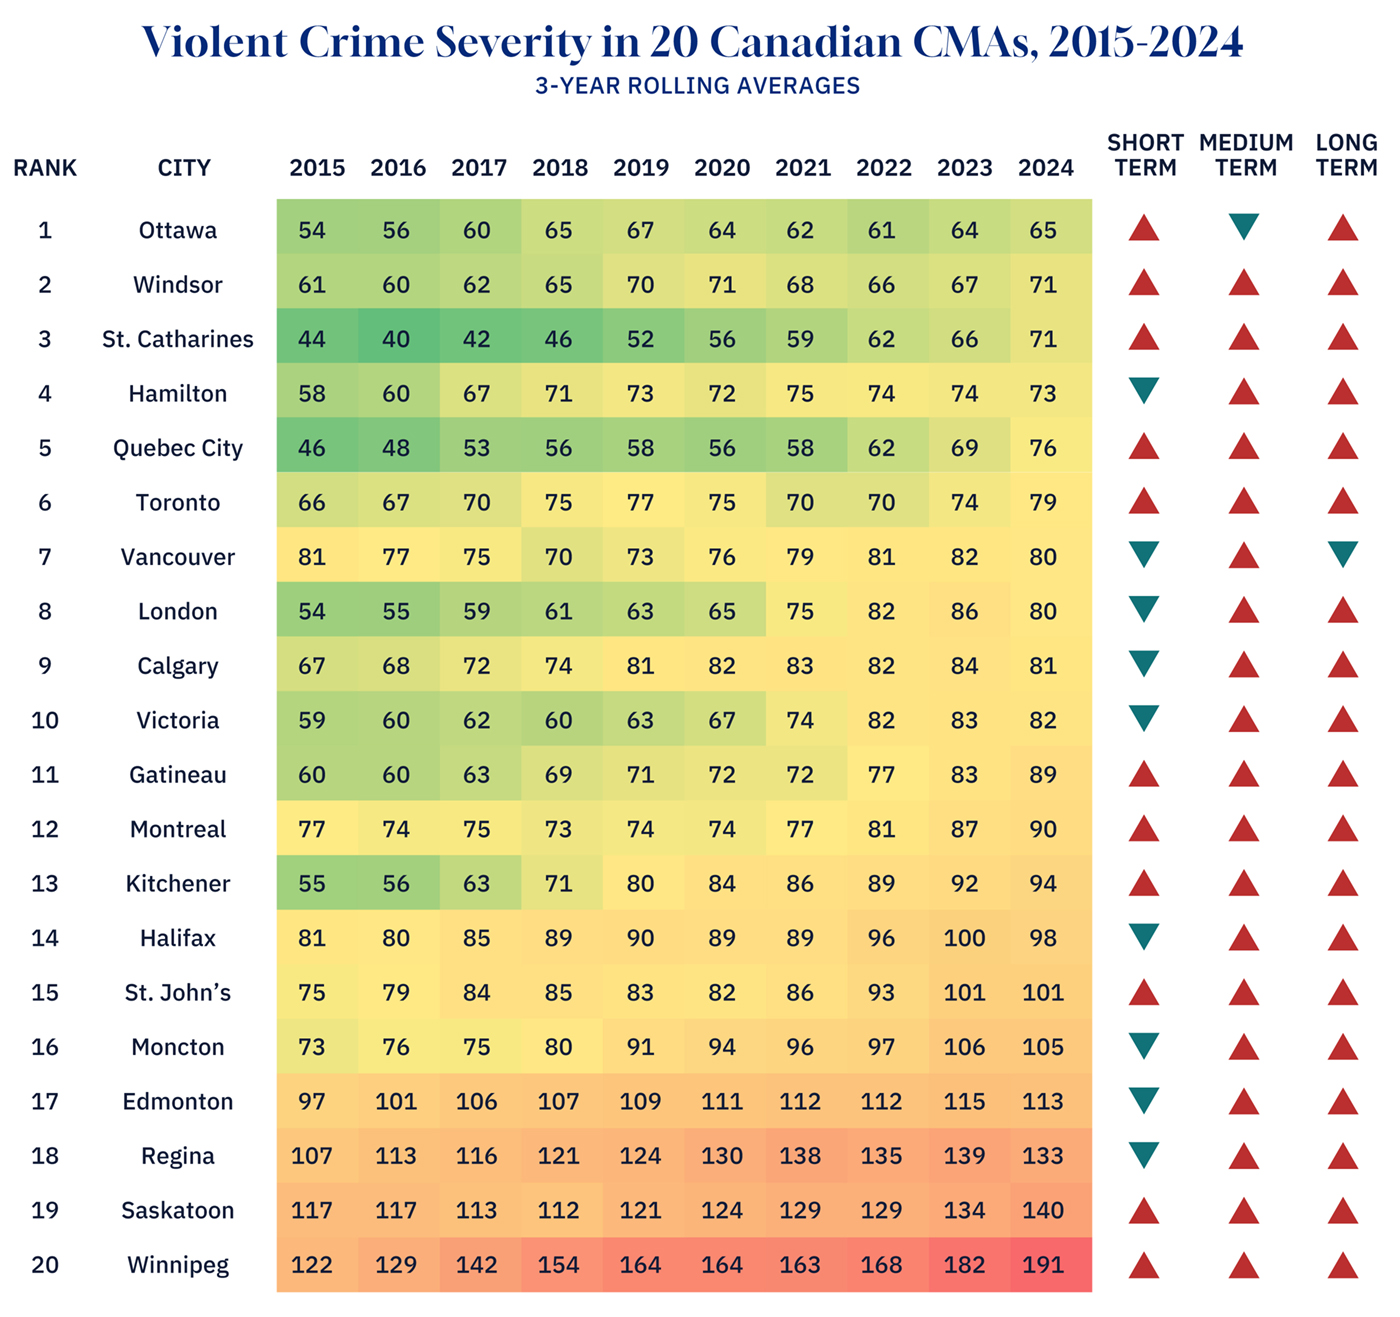
In a 2025 study for the Macdonald-Laurier Institute, Richard Audas and I analyzed violent crime statistics from 2013-2024 in Canada’s 18 largest CMAs for which data are available, as well as Moncton, NB, and St. John’s, NL. The figure below reproduces a “heat map” from that study, which tracks changes in violent crime severity over the last decade in those 20 CMAs. The heat map measures changes in rolling averages, and the final three columns track changes over the short term (one year, 2023-2024), medium term (five years, 2019-2024) and long term (the last decade, 2015-2024). The values with the highest violent crime severity are dark red, and the lowest crime severity is dark green (red is bad, green is good).
Graphic Credit: Janice Nelson.
The heat map shows that the decade-long growth in urban violent crime is widespread. Only one of the 20 CMAs (Vancouver) experienced a slight reduction between 2015 and 2024, while most experienced large increases.
In terms of absolute violent crime severity, there exists a clear regional dimension: the four Prairie cities of Winnipeg, Saskatoon, Regina, and Edmonton have the highest violent crime severity, followed by the Atlantic Canadian cities of Moncton, St. John’s, and Halifax (as a born-and-raised Atlantic Canadian, this surprised me; it did not surprise my friends and family who have lived there over the last decade).
While the lowest-severity CMAs are all located in Ontario or Quebec, those CMAs have nevertheless experienced increasing violent crime severity. Indeed, the highest increases in severity over the last decade occurred in Kitchener, Quebec City, and St. Catharines—a growth of 71, 63, and 61 percent, respectively.
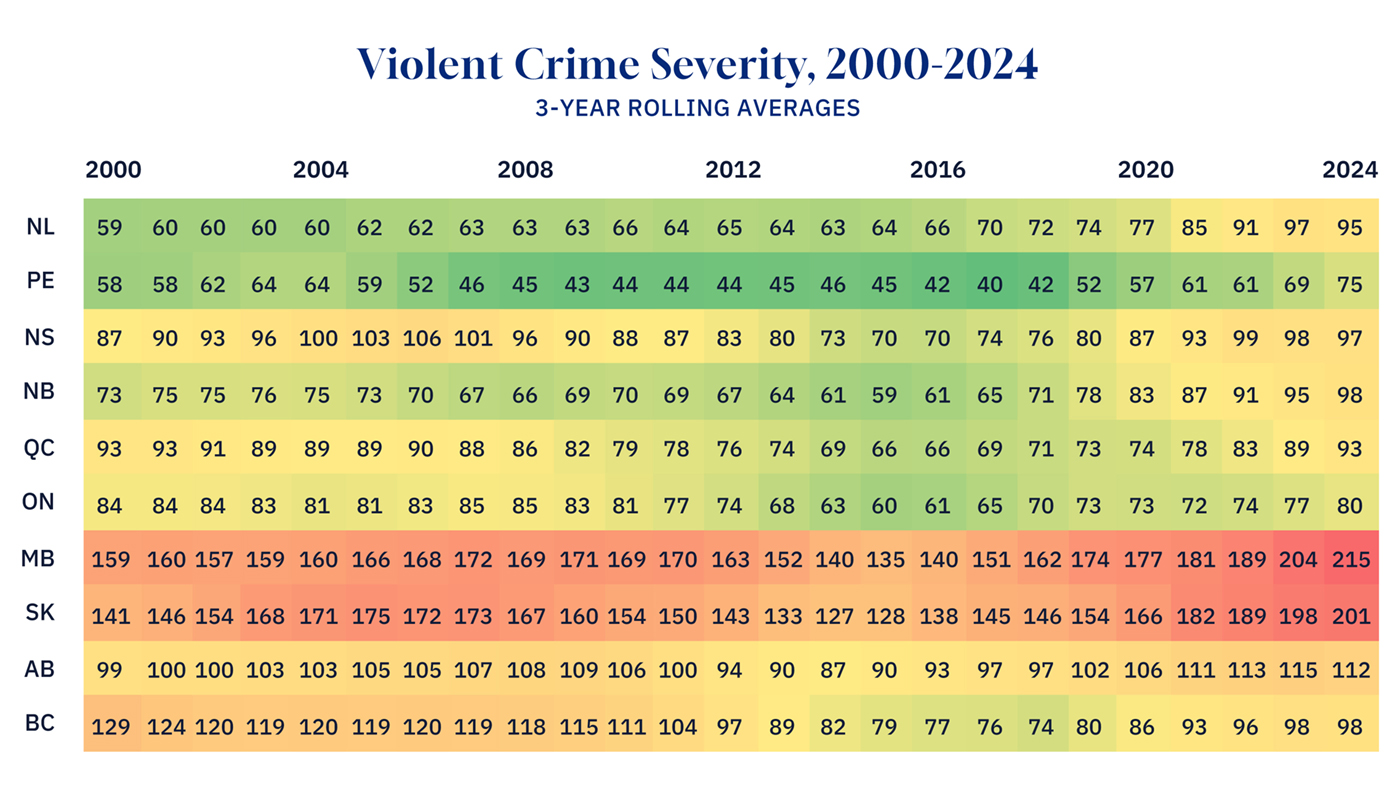
The next heat map looks at violent crime severity in the Canadian provinces, again using rolling averages.
Several trends are apparent. First, violent crime severity is much worse in Manitoba and Saskatchewan than anywhere else. These provinces have seen violent crime severity reach new heights in recent years: 2024 marked the year with the highest rolling violent crime severity in Saskatchewan and Manitoba since Statistics Canada began tracking in 1998, at numbers well beyond previous peaks in the mid-2000s (for both provinces, the highest non-rolling year was 2023, as it was for Canada as a whole).
Graphic Credit: Janice Nelson.
Second, while other provinces cannot match Manitoba’s and Saskatchewan’s high severity, most provinces are currently experiencing record highs. In every province except Nova Scotia, Ontario, and British Columbia, violent crime severity in 2023 and/or 2024 was at least as high as it has ever been since Statistics Canada’s tracking began in 1998 (B.C. is the one jurisdiction for which violent crime severity has decreased well below its early-2000 high).
In most provinces, the last decade has not merely seen violent crime severity return to mid-2000 highs; instead, it has surpassed those previous highs, often by a wide margin.
How does this square with the first two charts, which showed that Canada experienced a relatively equivalent fall and rise of violent crime severity between 2006 and 2024? The answer: Ontario, and to a lesser extent, Quebec.
While Ontario has experienced a significant growth in violent crime severity since 2014, it has not yet surpassed its levels from the mid-2000s; Quebec, meanwhile, has only just equaled its highs from the early 2000s.
And herein lies the problem with reporting on crime statistics that comes primarily from a national media dominated by Ontario and Quebec. When roughly 60 percent of the population lives in jurisdictions where violent crime severity has not risen as dramatically, media discussion of national crime statistics can understate the severity of trends in other provinces. This is precisely what has occurred in the context of Canadian violent crime severity.
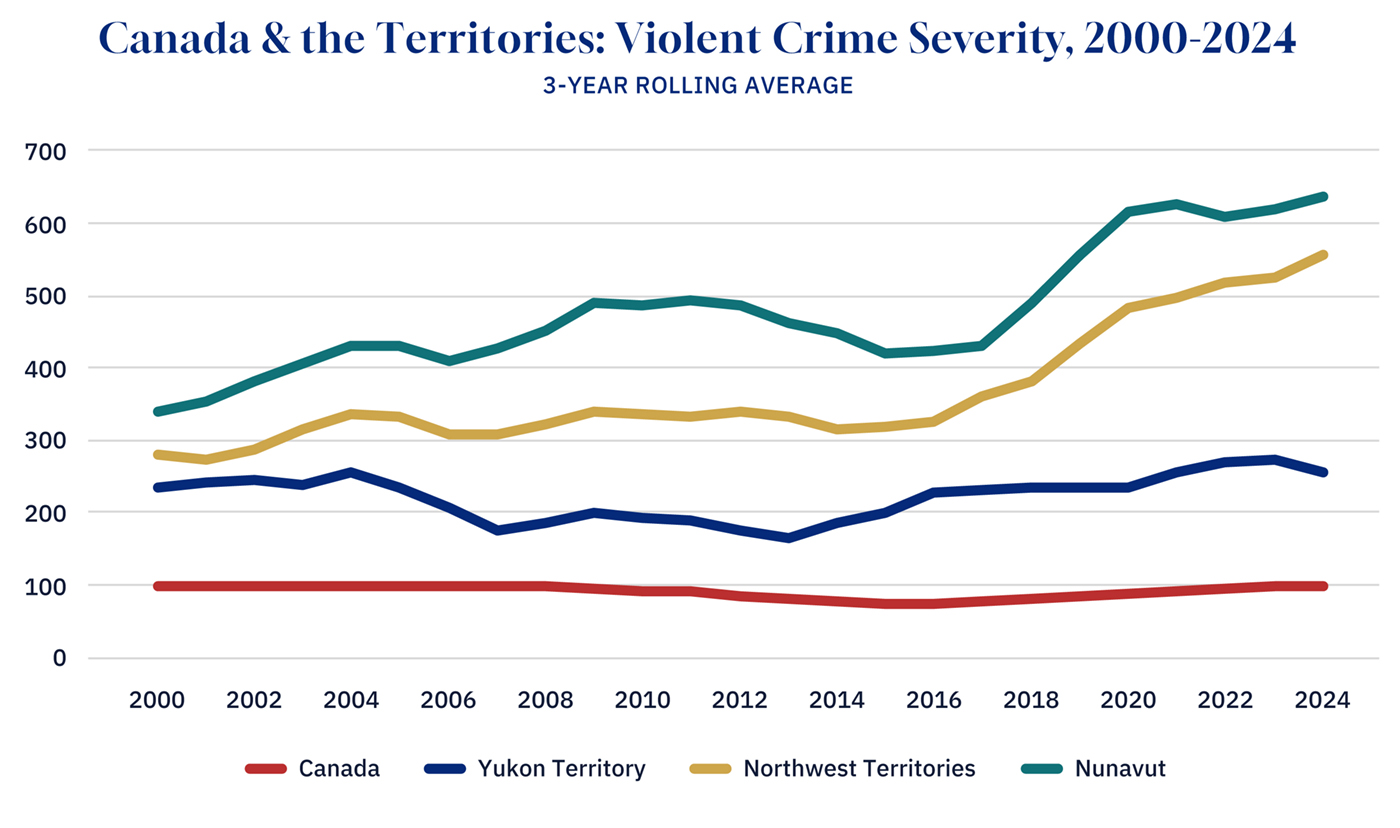
Finally, the territories deserve special mention. Crime in the territories is notoriously high and growing, something the chart below (which includes the overall Canadian rate for context) confirms. In NunavutAs the violent CSI was unavailable for Nunavut in 1998, its 2000 rolling average is an average of 1999 and 2000 data. and the Northwest Territories in particular, violent crime severity has skyrocketed to more than five times the national average. Violent crime remains a crisis in much of Canada’s North, and unfortunately, shows no sign of slowing down.
Graphic Credit: Janice Nelson.
Public perceptiveness, elite misperception
This DeepDive has provided statistical context to explain Canada’s surge in violent crime over the last decade. The numbers show that, counter to certain media narratives, the last few years have seen violent crime severity return to or surpass the highest levels seen this century. No province, territory, or city has been immune from the growth in violent crime severity, which in most provinces now exceeds all previously recorded levels in Statistics Canada’s crime severity time series.
Even with the benefit of hindsight, it is impossible to state with certainty why violent crime was so high in the early 2000s, dropped precipitously until 2014, and has risen more or less uninterrupted since. Determining the causal factors behind rising crime rates is notoriously difficult.
But there can be little doubt about the social and political context in which severity has increased: it has spiked during the exact period in which the criminal justice system has come under increasing strain, and our cities have been overrun with generalized disorder.

As Richard Audas and I have documented elsewhere, Canada’s criminal justice system is in a state of crisis. A growing number of cases are stayed or withdrawn; police clearance rates have plummeted; the proportion of people on remand in provincial corrections has skyrocketed, rising to an astonishing 86 percent in Ontario; and there are countless stories of shocking violence committed by perpetrators out on bail.
Meanwhile, the opioid crisis emerged just as drug consumption sites proliferated and jurisdictions experimented with drug decriminalization, non-enforcement, and the supply of free drugs. There is an increasing sense that large swathes of cities have become “no-go zones” characterized by “a palpable sense of social breakdown and official impotence or indifference”—and in rural areas, things are even worse.
As Stephen Staley wrote in these pages, “what ultimately drives politics is not statistical crime rates; it is lived disorder.” We feel unsafe because we have borne witness to our cities becoming dens of organized crime, uncontrolled antisemitic protests, open drug use, and visible social breakdown.
The data on violent crime severity supplements what Canadians are witnessing with their own eyes: police and governments have lost control of law and order.
View reader comments (11)
The purpose of this DeepDive is not to propose policy solutions. Instead, it is to present the data on violent crime severity for all to see. In so doing, I end with two observations. First, public discourse is enriched when we better understand the nuances of criminal justice data. It is not enough to merely point to a one-year dip in crime rates or to tell Canadians that overall crime is down since 1992. A more complete understanding of the severity of violent crime requires an in-depth analysis of long-term trends across cities, provinces, and territories.
Second, the media should stop clinging to the narrative that, because certain crime statistics were worse in the 1990s, things aren’t so bad. A recent Globe article about the (refreshingly positive) 2025 homicide numbersWhile preliminary 2025 homicide numbers from several cities are down considerably, the growth in violent crime severity over the last decade was not driven by homicide rates, which remained stable in most cities over that period. from several cities was a classic in the genre, with quotes from activists and criminologists referring to the “historic lows” of the mid-2010s, high manslaughter rates in the 1970s, and high homicide rates in the United States.
If the media are going to chastise Canadians for feeling unsafe while crime rates are supposedly “dropping,” journalists—and the “experts” they cite—ought to examine the data more closely before doing so.
Whether because of the low-level lawlessness or the rise in violent crime severity, the public is right to be concerned about crime. Canadians are not misreading the moment—they are living it.

Dave Snow is an Associate professor in political science at the University of Guelph and a senior fellow at the Macdonald-Laurier Institute.
The violent crime severity index in Canada reveals a significant increase in violent crime across the country over the last decade. Contrary to some narratives suggesting crime rates are dropping, the analysis of Statistics Canada data shows violent crime severity has risen in nearly every province and major city, often surpassing previous highs recorded since 1998. Public concern about violent crime is justified, as the data reflects a real increase in severity. There are severe regional disparities, with the Prairie provinces experiencing the highest levels of violent crime severity. Media outlets should stop downplaying the issue and adopt a more nuanced understanding of criminal justice data.
Why does the article suggest national crime statistics can be misleading when discussing violent crime severity in Canada?
How does the Violent Crime Severity Index (VCSI) differ from simply looking at crime rates, and why is this distinction important?
What factors does the author suggest might be contributing to the rise in violent crime severity in Canada?


Comments (11)
Important article. Unless we agree that there is a problem, how can it be addressed?
Crime is a decade-scale lagging indicator of societal health. We clearly have a national problem with this trend. Hopefully, the conversation on data-driven solutions can be non-partisan (even in this forum)…